What’s a Trend Line?
A trend line is straight line drawn on a price chart which connects two or more significant high or low prices. For traders, trend lines visually show the market’s direction, help spot trends and potential reversal points.
Trend lines are essential for technical analysis because they clearly show traders the overall market direction. By linking a series of higher lows in an uptrend or lower highs in a downtrend, trend lines show a clear visual representation of market direction. This information helps traders make smart decisions.
Types of Trend Lines
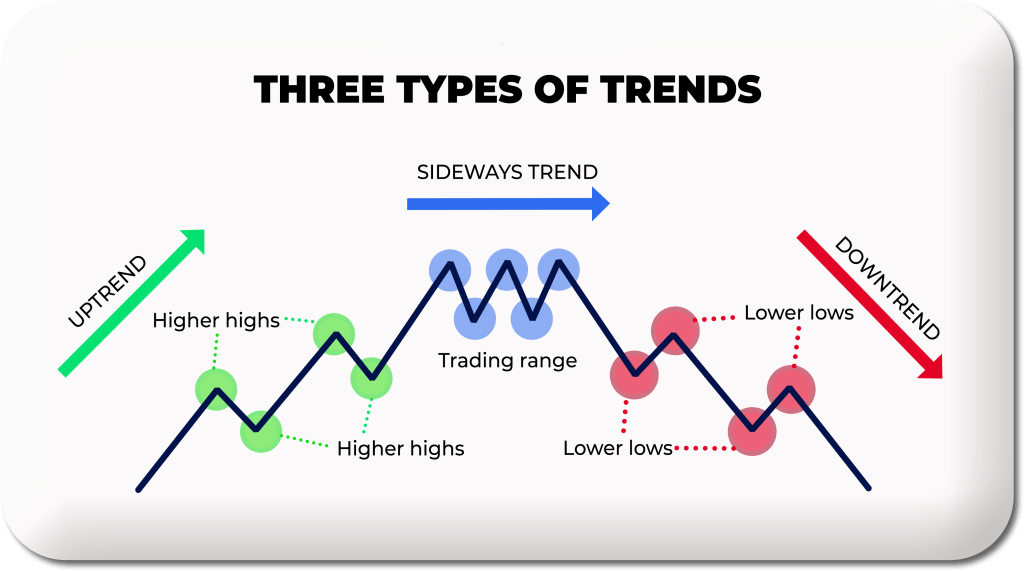
Uptrend Line: This line is drawn by joining a series of higher lows, signaling bullish market conditions.
Downtrend Line: It is drawn by connecting a series of lower highs, signaling bearish market conditions.
Sideways Trend Line: It is drawn in range-bound market where prices move horizontally without clear direction. Knowing these types of trend lines assists traders in determining the current market trend so they can adjust their strategies accordingly.
Drawing trend lines
Drawing trend lines well in trading is an important skill for technical analysis. It means spotting the overall trend direction and connecting important price points to show possible support or resistance levels.
The Correct Method to Draw Trend Lines on Price Charts:
These are the following steps to draw trend lines accurately
- Check trend direction (uptrend, downtrend or sideways) by looking at price action and sequence of higher highs/lows or lower highs/lows.
- For uptrends, find at least two important swing lows and join them with a straight line. This line is an uptrend line and can act as support level.
- For downtrends, spot at least two major swing highs and join them with straight line. This line represent downtrend line and serves as resistance level.
- Make sure trend line connects the most relevant swings, ignoring minor price fluctuation.
- Extend trend line forward to anticipate future support or resistance zones.
Importance of Connecting Significant Swing Highs and Lows
It is important while drawing trend lines in trading to connect swing highs and lows. As These points show where the market has changed direction and indicate support and resistance levels. After connecting these swing highs/lows, traders can predict where price may find buying and selling pressure. When price line touches trend line multiple times, it makes trend line more legit and reliable.
The Role of Trend Lines in Identifying Support and Resistance Levels
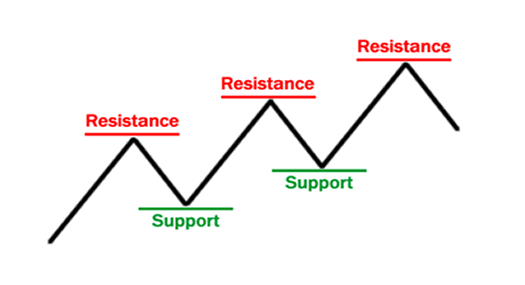
Trend lines visually show support and resistance levels, which are important concepts in trading. Support level is a point where buyers might push price back up, potentially reversing a downtrend. While, Resistance level represents an area where selling pressure may increase, potentially reversing an uptrend.
After drawing accurate trend lines, traders can spot these important levels and make smart trading choices. For example, traders can go for long position when the price is close to an uptrend line (support) or short position when price is close to downtrend line (resistance). Mastering trend lines allows traders to see market trends, spot support and resistance levels and make smart trade choices according to price action and market sentiment.
Trend Line Validation and Confirmation
Validating and confirming trend lines in trading is important to ensure their reliability and effectiveness in technical analysis. This involves several criteria and methods to asses strength and significance of a trend line.
Criteria for a Valid Trend Line
- Multiple Touches: A solid trend line has multiple price touches or bounces along its path. frequent interactions of price line with trend line without breaking it means stronger validation of trend lines. Each touch reaffirms the importance of the trend line in capturing market sentiment.
- Angle: The angle of trend line is also important. A steep trend line can show a strong trend but may not last long. Meanwhile, a shallow trend line suggests a weaker trend but may be prove more reliable over time.
- Duration: The longer a trend line holds up, the stronger the underlying trend. A trend line respected over a long period carries more significance than one that has only been in place for a short time.
Importance of Volume in Confirming Trend Line Breakouts or Breakdowns
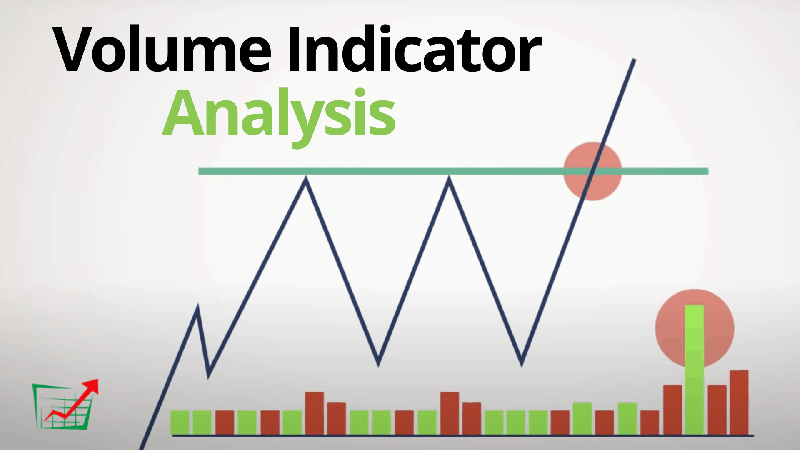
While trading, volume plays an important role in confirming whether trend lines are valid. A rise in volume as price approaches or bounces off the trend line provides confirmation. This increase in volume shows strong market conviction in the prevailing trend.
When a trend line breaks, an increase in volume can confirm the breakout or breakdown. This volume confirmation helps traders distinguish if it’s a genuine breakout or a false one, which reduces the possibility of bad trading decisions.
Using Other Technical Indicators to Confirm Trend Line Signals
To improve reliability of trend lines, traders also use some other technical indicators as well like:
- Relative Strength Index (RSI): RSI can confirm trend line signals by showing overbought or oversold conditions. For example, if the price line breaks the trend line and RSI is also moving out of an oversold zone, it adds credibility to the breakout.
- Moving Average Convergence Divergence (MACD): MACD is used to identify shifts in market momentum. A trend line breakout with bullish MACD crossover provides strong confirmation of the new trend direction.
Importance of Trend lines in Trading
Trend lines in trading is essential for technical analysis. These lines offer traders valuable information about market trends and potential price movements.
How Trend Lines Help in Identifying Market Trends
Trend lines help traders spot market trends and after connecting major highs and lows, trend lines show whether market is uptrending and downtrending, or sideways. This quickly tells traders the overall market direction and helps them make informed choices about their trading strategies.
Using Trend Lines to Make Better Decisions
Trend lines act as dynamic support and resistance levels. These trend lines help traders make entry and exit choices. In uptrends, a trend line serves as support level that signals possible buying opportunities when price is near the trend line. In downtrends, trend lines act as resistance level which indicates potential selling chances.
Trend Lines as a Tool for Potential Reversals
When a price line breaks through an established trend line, it means shifting market sentiment and possible trend reversal. This gives traders an early alarm to adjust their positions accordingly. Adding other technical indicators like volume or momentum oscillators improves reversal signal accuracy. In short, trend lines reveal market trends, inform trades, and flag reversals.
Advantages and Disadvantages of Using Trend lines
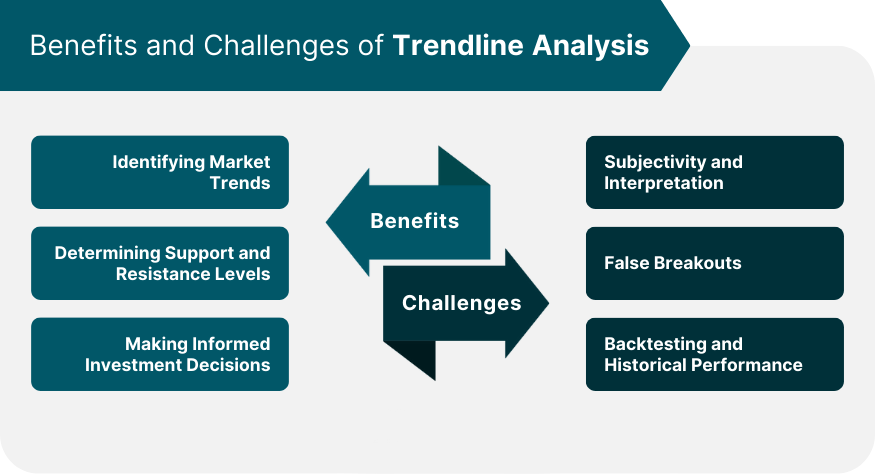
Simplicity and Effectiveness of Trendlines in Market analysis
Trend lines are famous in trading because of their simplicity and effectiveness. Traders use trendlines because they clearly show the market’s direction by connecting important price points. This visual representation helps traders spot market trends, make quick and smarter moves. Trendlines have a diverse nature and work across other markets too, such as stocks, forex, commodities etc.
Limitations and Challenges in Using Trendlines Accurately
Despite of many advantages, Trend lines have some disadvantages too which are
- Subjective – trend lines are subjective and can have different interpretations among traders. This can result in conflicting signals and bad trades.
- False signals – Trend lines can generate false signals especially when market is volatile or consolidated. A break in trend line is not always interpreted as trend reversal, make sure to confirm with other indicators too.
- Time limitations – A trendline on a 5-minute chart may not fit a 15-minute chart. This will affect the reliability of chart across different time frames.
- Backward-looking – They show past price data but can’t account for new information or sentiment shifts that can impact future prices.
Trend Line Trading Strategies
Trend line strategies help traders make profits from market trends. These lines are used in trading strategies to identify entries and exits, manage risk and enhance trading performance.
Basic Strategies for Trading with Trend Lines
- Trend line bounce: it involves entering a trade when price touches a trend line and bounces off it. In uptrends, traders are looking for buying opportunities as the price bounces back up again. In downtrends, traders are looking to sell when price touches a trend line and falls back again. This technique relies on trend line acting as support or resistance levels.
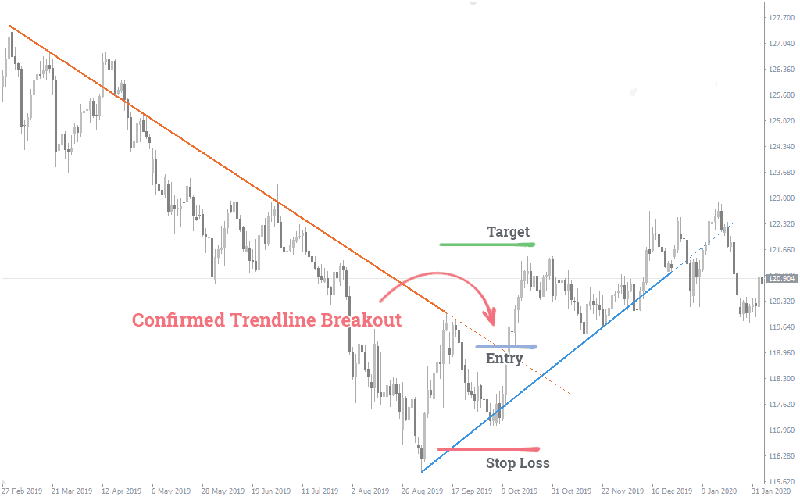
- Trend line Breakout: it is technique in which trading takes place when a price line breaks through a trend line. A breakout above downtrend line signals potential bullish reversal. while a breakout below uptrendline signals potential bear reversal. Use volume or momentum oscillators to confirm.How to use Trend Lines for Entry and Exits pointsEntry points When the price touches and bounces off an uptrend line, enter long position. When the price breaks above a downtrend line, take long position. Similarly, when the price touches and falls from a downtrend line or breaks below an uptrend line, take a short position. .Exits points: Set exit points using recent swing high/low. For long position, target most recent swing high anforor short position, target most recent swing low. Also, use trail stop-loss order to lock in profits as it price fluctuates in your favor.
Advanced Trend Line Techniques
Advanced trend line techniques upgrade basic use of trend lines in trading by incorporating multiple timeframes, dynamic levels and complex systems.
Using trend Lines in Multiple Time Frames
Analyzing trend lines across short-term, medium-term and long-term charts provides complete overall view. A trend line on daily chart shows long-term trend and an hourly chart defines short-term shifts. Aligning trend lines from different frames can help identify stronger support and resistance levels for informed decisions.
The concept of dynamic Support and Resistance with Trend Lines
Unlike static horizontal levels, dynamic support/resistance changes with price. Trend lines act as dynamic support in uptrends and resistance in downtrends. These important levels keep adjusting as trends progress and help traders set accurate stop-loss and take profit targets.
incorporating Trend Lines into Complex Trading Systems and strategies
Advanced traders often mix trend lines with other technical indicators like moving averages, RSI(Relative Strength Index) or MACD(Moving Average Convergence Divergence (MACD) to build strong trading systems. Combining trend lines with these can make the trend signals more reliable. Using trend lines to spot patterns like triangles, wedges or channels can also confirm possible breakouts or reversals.
Fan Lines and Speed Lines
Fan lines and speed lines build on basic trend lines and provide more potential support and resistance levels. Fan lines spread out from one point at different angles while speed lines come from retracement levels. These tools help traders predict future price moves and spot key levels for trades.
Trend Line Channels
Trend line channels have two parallel trend lines around the price action. Channels can go up, down or sideways. Trading inside channels means buying near the lower trend line (support level) and selling near the upper one (resistance level). Breakouts from these channels can signal trend changes or continuations of trading opportunities.
Conclusion
Trend lines are invaluable trading tools for technical analysis. They help spot market trends, make informed trades, and find possible reversals. Even with their simplicity and usefulness, trend lines have limits and need skill to use effectively. Combining with other indicators and advanced techniques strategies can increase trading performance.