Technical analysis is an important tool for traders and investors to assess securities (stocks, ETFs, etc.) and forecast price movements. Unlike fundamental analysis, which looks at a company’s financial health and intrinsic value, technical analysis relies on historical market data like past prices and trading volumes to spot trends and patterns.
Technical analysts use various tools and techniques, like charts, indicators and oscillators, to make better trading decisions.
What’s Technical Analysis?
Technical analysis evaluates securities, like stocks, by analyzing statistics from market activity, including past prices and volumes. Technical analysts think a stock or market’s historical performance suggests future performance.
It’s a method to predict a security’s probable future price movements, like a stock or currency pair, based on market data. The theory is that the collective actions of all the traders in the market accurately capture all relevant information, constantly assigning fair market values to securities.
Technical analysis is not just for technical traders. Many fundamental traders use fundamental analysis to decide whether to buy into a market, but once investors decide, they then use technical analysis to pinpoint good and low-risk entry price levels.
The two main variables for technical analysis are the timeframes considered and the specific technical indicators that a trader uses.
History of Technical Analysis

Technical analysis traces back to 17th century Dutch markets, as described by Joseph de la Vega. In 18th century Japan, Homma Munehisa used candlestick patterns to trade rice futures.
However, the Dow Theory developed by Charles Dow in the late 19th century, established the foundation of modern technical analysis. Dow recorded stock price movements and used data to spot trends and patterns.
In early 20th century, pioneers like William P. Hamilton, Robert Rhea, Edson Gould and John Magee advanced and popularized Dow’s work further. They introduced concepts like trend analysis, chart patterns and market psychology that form the core of technical analysis today.
With advent of computers in the late 20th century, technical analysis became more sophisticated and widely used by traders and investors worldwide.
Core Principles of Technical Analysis
Principles are based on the idea that historical price and volume data can predict future market behavior, including some principles, which are:
- Prices reflect everything: All relevant market information, like fundamental factor, market psychology and supply/demand gets reflected in the price.
- Price trends: Prices tend to trend up, downward, or sideways.
- History repeats: Investors think that certain price patterns repeat themselves due to market psychology. Studying past actions helps identify and use these patterns for decisions.
- Volume and price are related: Volume is important for confirming price trends and patterns. High volume accompanies big market moves.
Types of Technical Analysis Charts
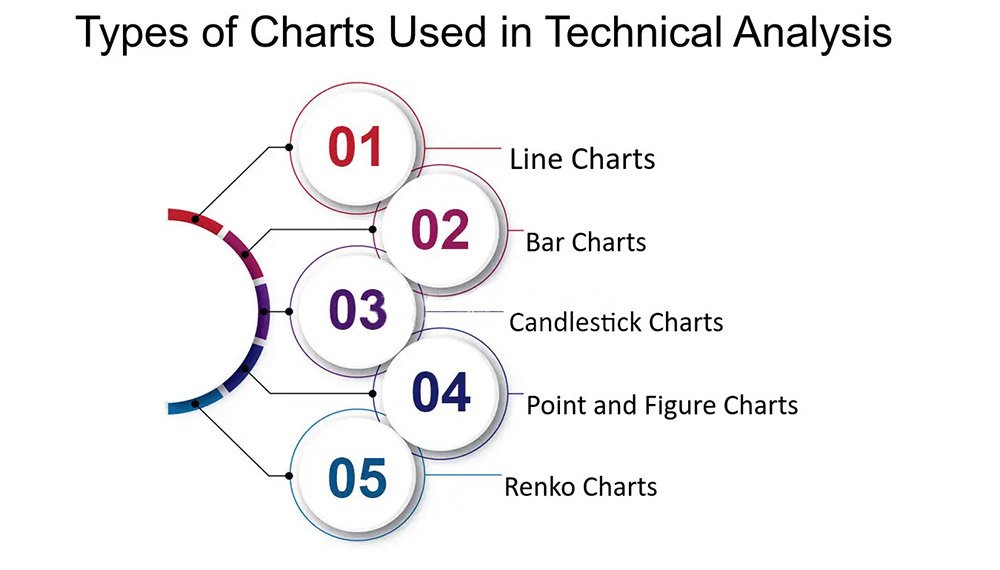
Several chart types visualize price and volume data in technical analysis.The most common ones are:
- Line charts: Line chart is the simplest chart, connecting closing prices with a line. Good for spotting trends and support/resistance levels.
- Bar charts: Vertical bars show open, high, low and close (OHLC) prices for each period and gives more detail than line charts.
- Candlestick charts: Candlestick charts are like bar charts but with color-coded rectangular “candles” indicating if close was higher or lower than the open. Candlestick patterns can signal potential trend reversals.
- Point and figure charts:It focuses only on price movements, ignoring time and volume. Shows columns of Xs (rising prices) and Os (falling prices).
Key Technical Indicators
Many technical indicators provide unique insights on market trends, momentum, volatility and potential price movements. Some widely used and important ones are:
Trend Indicators
Trend indicators identify direction and strength of a trend. Popular ones are:
- Moving Averages (MA): Simple Moving Average (SMA) & Exponential Moving Average (EMA) smooth out price data into a singal flowing line, helping spot trends.
- Moving Average Convergence Divergence (MACD) : MACD shows a relationship between two moving averages (MA) of a security’s price, indicating momentum and trend direction.
Momentum Indicators
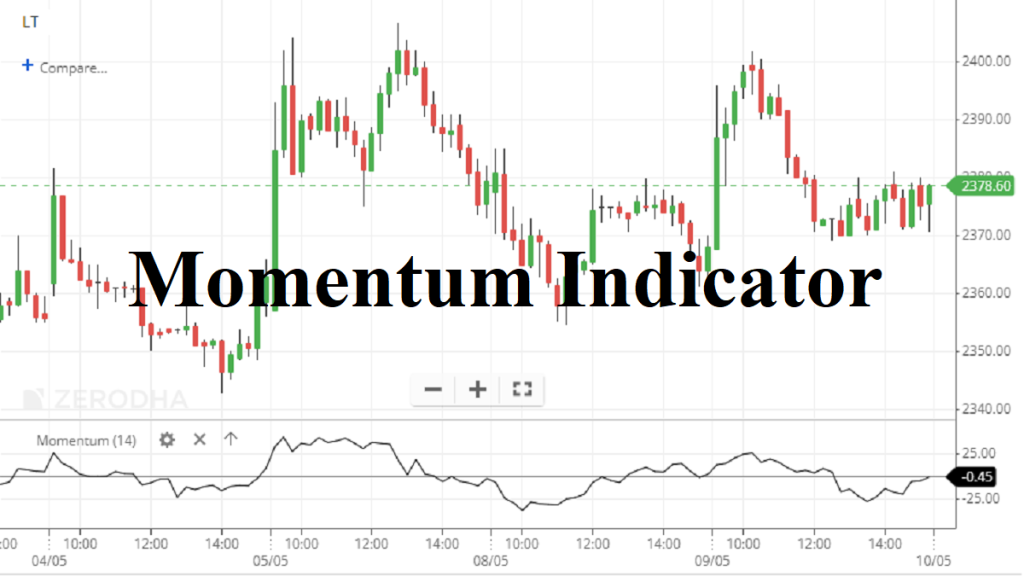
Momentum indicators measure the speed and power behind price movements. They help spot when prices get overbought or oversold. Major momentum indicators are:
- Relative Strength Index (RSI): RSI compares the size of recent gains versus recent losses to measure price momentum and signals if conditions are overbought or oversold.
- Stochastic Oscillator: This indicator looks at the closing price compared to the price range over time to spot overbought or oversold conditions.
Volume Indicators
Volume indicators measure the strength of a trend or confirm the market direction based on trading volume. Key volume indicators are:
- On-Balance Volume (OBV): OBV adds volume on up days and subtracts it on down days to measure buying and selling pressure.
- Chaikin Money Flow: This oscillator combines price and volume to gauge buying and selling pressure.
Volatility Indicators
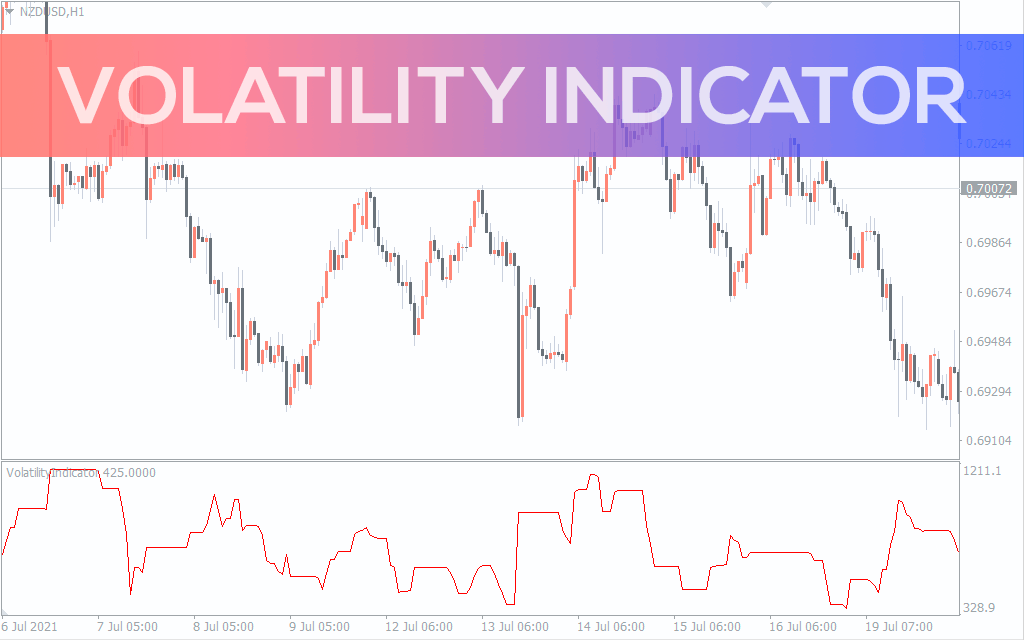
Volatility indicators measure the speed and size of price movements to identify potential reversals or breakouts. Widely used volatility indicators include:
- Bollinger Bands: Bollinger Bands plot standard deviations above and below a moving average in response to volatility. ****Prices touching the bands can signal overbought or oversold conditions.
- Average True Range (ATR): ATR measures market volatility by breaking down the full assest price range over a period.
Technical Analysis Tools and software
Traders use different tools and software to perform analysis and make smart trading decisions. Some key items are:
- Charting platforms: TradingView, MetaTrader, Thinkorswim etc offer customizable charts, multiple timeframes and drawing tools.
- Technical indicators: Moving averages, MACD, RSI, Stochastic Oscillator and Bollinger Bands help to spot trends, momentum and volatility.
- Pattern recognition software: Software like TrendSpider, Investar etc automatically find chart patterns and support/resistance.
- Backtesting and optimization: TradeStation and NinjaTrader let traders test and refine strategies using historical data.
- New Fundamental analysis: Bloomberg, Benzinga Pro and Finviz provide real-time news, economic data and financials to complement technique analysis.
Why Technical Analysis is Important?
Technical analysis helps traders make informed stock market decisions by providing insights into trends, price patterns and potential entry/exit points. Here’s why it’s useful:
- Identifying trends:Technical analysis helps identify upward, downward or sideways market trends so traders can adapt strategies accordingly.
- Find entry/exit points: Studying price history and patterns points out optimal times to enter or exit trades.
- Understand market psychology: Provides insights into market sentiment and investor behavior which influences prices.
- Complements fundamental analysis: While focused on price action, technical analysis can be use in conjunction with fundamental analysis for a more comprehensive approach.
How to Trade Using Technical Analysis
Here are the steps to trade using technical analysis which are:
- Choose a market : like stocks, forex, or commodities that you understand and want to trade.
- Select timeframe – short-term (minutes to hours) or long-term (days to months) – that matches your trading style.
- Identify trends using tools like trendlines and moving averages to see the overall market direction.
- Analyze charts to find potential entry and exit points by looking at price action, patterns and indicators.
- Make your trades once you spot an opportunity using technical analysis. Be sure to use proper risk management, like stop losses and take profit levels.
- Keep monitoring and adjust your positions as needed based on the latest technical analysis by continuously monitor.
It takes practice and experience to get good at technical analysis. Start slow with a demo account and then progressively build your skills and confidence before trading real money.
Advantages and Disadvantages of Technical Analysis
Technical analysis has pluses and minuses that traders should think about when investing in stocks which are:
Advantages
- Helps identify trends and gives clear entry and exit points based on price movements and indicators
- Can analyze securities across different markets like stocks, forex and cryptocurrencies
- Can combine with other methods like fundamental analysis for a more well-rounded approach
Disadvantages
- Relies on past price data which may not reflect future movements accurately and can generate false signals
- Doesn’t account for company fundamental factors such as financial health, which can greatly affect stock prices
- It can be time-intensive for beginners as you analyze multiple charts and indicators
- Open to interpretation so traders may disagree on the same security
Risk Management in Technical Analysis
Risk management matters a lot when using technical analysis to trade. When making trading choices based on technical analysis, it’s key to use risk management plans to limit potential losses. Some popular ways technical analysts control risk are:
- Using stop-loss orders to automatically exit a trade if the price turns against you by a pre-set amount.
- Diversifying your portfolio across different asset types, industries, and markets to distribute risk.
- Position sizing to ensure no single trade is too large a part of your whole portfolio.
- Factor risk-reward ratios into your analysis to confirm that potential rewards justify the risks.
Combining technical analysis with solid risk management rules helps traders boost their chances of long-term success in the markets while protecting capital from major losses.
Limitations of Technical Analysis
While technical analysis is very useful for traders and investors, some weak spots need awareness which are:
- Subjectivity: technical analysis charts and patterns involves interpretation, which can be subjective and vary between analysts. Different experts may draw different conclusions from the same data.
- Past performance: Technical analysis depends heavily on historical prices and volumes, which do not always accurately predict future market actions. Past trends and patterns fail to guarantee future outcomes.
- Fundamental factors: Technical analysis doesn’t account for big picture factors like economy, company finances and industry trends that can majorly impact asset prices.
- Self-fulfilling prophecy: Widely followed indicators may cause traders to act alike, leading to self-fulfilling prophecies and weird market behavior.
- Noise and false signals : Short-term price changes, market noise and anomalies can generate false signals and incorrect reads on technical indicators.
Developing a Trading Strategy
Making a successful trading strategy means blending technical analysis with solid risk management principles. Here are key steps which are:
- Pick trading style (day trading, swing trading) based on personality and time available.
- Choose analysis method (technical analysis, fundamental analysis, or both).
- Select indicators and chart patterns fitting strategy.
- Set entry and exit rules based on analysis.
- Use risk techniques like stop-losses and position sizing.
- Backtest and refine strategy with historical data.
- Paper trade or demo first to gain experience before real money.
Constantly reviewing and adapting strategies is crucial for long-term success in markets.
Practical Application of Technical Analysis
Technical analysis has lots of practical uses in financial markets. Traders and investors apply it to spot trading chances, make buy/sell calls and manage risk. Some important real world applications are:
- Identifying price trends and potential reversals using chart patterns and indicators
- Pinpointing best entry and exit points for trades
- Setting stop-loss and take-profit levels to control risk
- Backtesting and fine tuning trading strategies
- Complementing fundamental analysis for well-rounded approach
Conclusion
Technical analysis empowers traders and investors, revealing market trends, price patterns and potential opportunities. While it has limits and should pair with other forms of analysis, it brings data-driven decision making to trading.
By examining historical prices, spotting patterns and using technical indicators, traders can build strategies, control risk and time entries and exits more effectively. However, it’s important to remember that it doesn’t guarantee success and markets can swiftly change.
Ultimately, technical analysis will benefit any trader or investor but it requires solid risk management, constant learning and a disciplined approach to stock markets.