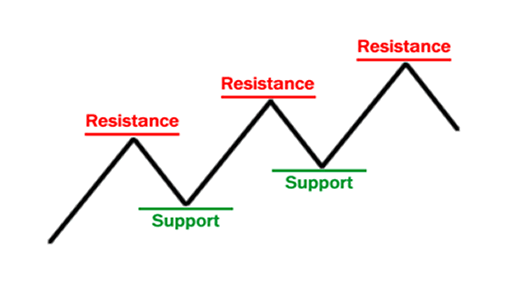
Support and resistance levels are important ideas in technical analysis. They identify price points on chart where an existing trend may take break or potentially reverse. A support level is a price level where concentration of demand rises enough to a point where the downtrend may stop. A price level where the supply rises to a point where an uptrend may pause, is known as resistance level.
The formation of support and resistance level is highly associated with market psychology. These levels are often influenced by trader’s psychology such as expectations, fear and greed. When prices reach close to these levels, traders often react in a certain way based on their past experiences there.
How These Levels Are Identified on Price Charts
Support and resistance levels are spotted on charts by seeing historical price data, previous support and resistance points/levels and technical indicators. Traders look for areas indicating strong buying/selling interest where prices have been reversed repeatedly in past. These levels are shown with horizontal lines, trendlines and moving averages.
Finding Support and Resistance Levels
Spotting support and resistance levels on trading charts is important for traders and helps them make smart trading moves. There are following methods to identify these levels:
1. Historical Price data: Traders look at old price movements to find areas where prices have previously reversed or stalled. These historic levels can become future support or resistance.
2. Trendlines: Drawing lines connecting multiple price points can reveal dynamic support and resistance levels. An upward trendline serves as a support while, downward trendlines act as resistance.
3. Moving Averages: Moving averages like 50-day or 200-day act as dynamic support and resistance levels. When price is above average, it acts as support and when it is below price level, it serves as resistance.
4. Pivot Points: These points are calculated from day’s high, low and closing price of previous trading session. they help traders find potential support/resistance levels for current day’s trading session.
5. Fibonacci Retracements levels: These are the levels derived from Fibonacci sequence used to spot support and resistance levels, like 23.6%, 38.2%, and 50%.
The Importance of Time Frames in Determining the Strength of Support and Resistance Levels
- Short-Term: Levels on 5/15-min charts of shorter time frames can help day traders but may not be reliable like longer time frames.
- Medium-Term: Levels spotted on daily and weekly charts by traders show a balance between short and long-term time frames. Swing traders use medium term time frames to identify levels of support and resistance.
- Long-Term: Monthly/yearly charts show most significant levels, crucial for long-term plays.
Using Price Charts to Identify Levels
Price charts are important tools for identifying support and resistance levels:
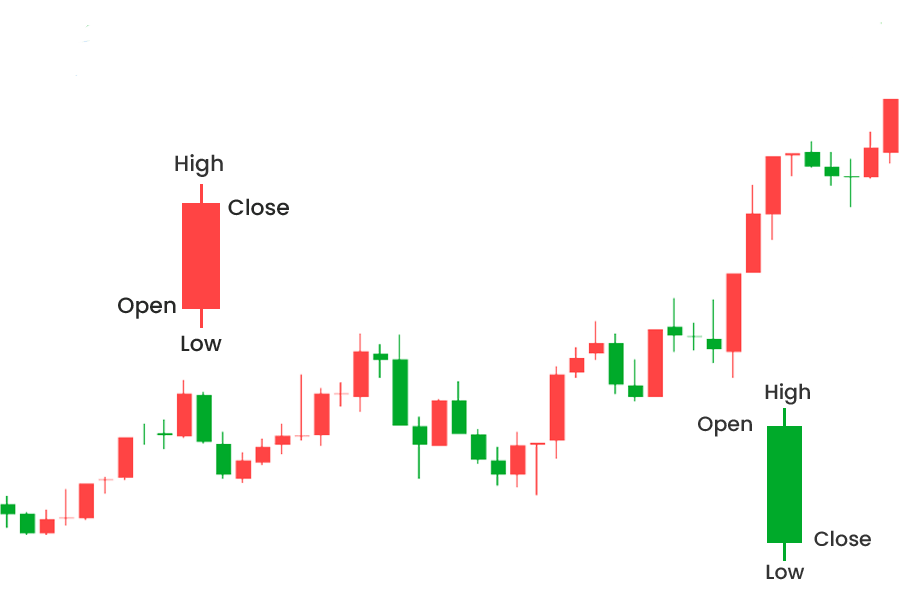
- Candlestick Charts: Candlestick charts indicate patterns such as hammers, shooting stars and engulfing patterns to identify support and resistance levels. For example, hammer formed at support level signals a price reversal.
- Line Charts: Plotting closing prices shows trends and levels clearly. Easy to spot key areas.
Technical Indicators for Support and Resistance
technical indicators which can help traders identify support and resistance levels are following:
- Moving Averages: As explain before, moving averages can serve as dynamic support and resistance levels.
- Fibonacci Levels: These levels help to identify potential reversal points in the market.
- Bollinger Bands: These bands, made up of a moving average and two standard deviations, can signal possible support and resistance levels based on volatility.
Role of Market Psychology in Support and Resistance Levels
Market psychology has a huge role in forming and strengthening support/resistance levels. Trader’s emotion such as fear, greed and hope have signicficant impact on their buying and selling choices. When prices approach support level, traders who previously bought there may feel confident and buy more, reinforcing the support. Similarly, as prices come close to resistance level, traders who bought at lower prices may sell to lock in profits, strengthening the resistance.
The Concept of “Psychological Levels”
Psychological levels, often represented by round numbers like $100 or $1,000, serve as support or resistance levels because they’re simple and easy to remember. Traders tend to place trade orders at these levels assuming that others will too. This collective behavior can create strong support/resistance zones. For example, a stock nearing $100 may see increased selling pressure as traders see it as a major milestone.
The Impact of Collective Memory on Market Behavior
“Collective memory” means ability of traders to remember previous price levels where prices saw big movements. These historical levels often impact current and future trades. If a price level acted as strong support or resistance in past, traders will expect similar behavior again. This expectation can become self-fulfilling prophecy because collective trader actions react at those price levels.
Strategies for Traders to Manage Their Own Psychological Responses
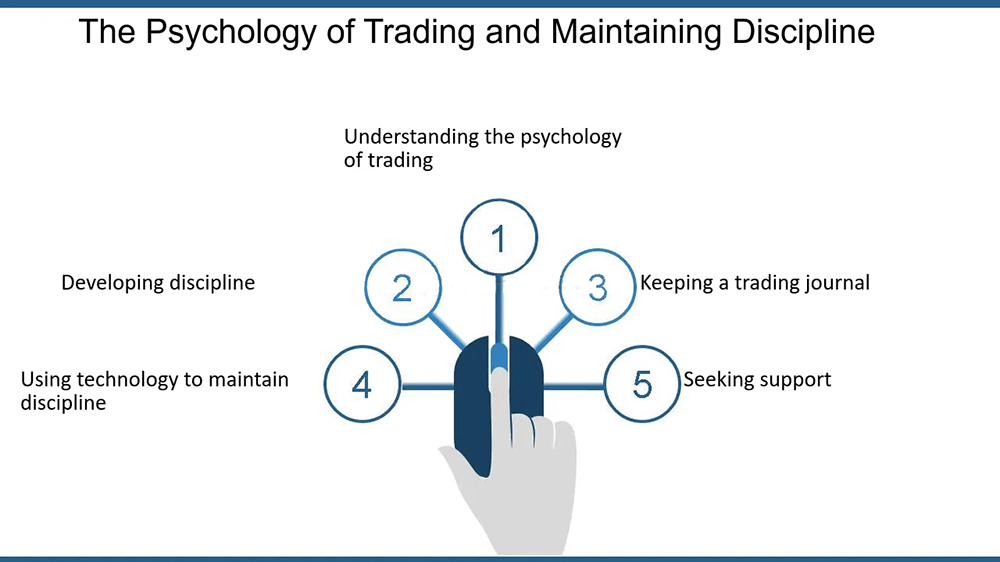
Controlling psychological responses is essential for successful trading near these critical support/resistance levels. Traders can use techniques such as:
- Set clear rules: traders should set rules for entering and exiting trades to reduce risk of emotional decisions.
- Use Stop-Loss Orders: traders can use top loss orders to limit losses and emotional impact of price fluctuations.
- Maintaining a trading journal: a trading journal can help traders assess their past experiences and make smart decisions.
- Practice mindfulness: traders should use this technique to stay calm and focused. this will help them reduce emotional influence in their trading choices.
Trading Strategies based on Support and Resistance levels
Support and resistance levels are important for technical analysis since they give potential entry and exit spots for trades. Some common trading strategies using these levels are:
Breakout and Bounce Tactics
Breakout trading strategy
The breakout strategy means entering a trade when price breaks through major support/resistance level. The idea is breakout signals a trend may keep going in direction of breakout.
- For bullish breakout (breaking above resistance), traders will enter a long position, expecting more upward momentum.
- For bearish breakout (breaking below support), traders will enter a short position, expecting downward movement to persist.
Bounce trading strategy
The bounce trading technique assumes that prices often “bounce” or reverse direction after approaching support and resistance levels. Traders aim to enter trade in opposite direction after the bounce.
- For bounce off support, traders will enter long position, expecting a reversal and upward move.
- For bounce off resistance, traders will enter short position, expecting a reversal and downward move.
Role Reversal strategy
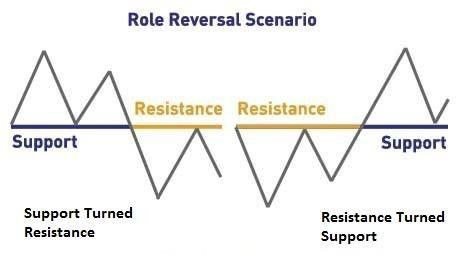
This technique means that a broken support level can become new resistance level, and broken resistance level can become new support level. It involves:
- Identifying breakout of major support and resistance level.
- Waiting for price to retrace and retest broken level.
- Entering trade in original breakout direction if price bounces off retested level. For example, if resistance level breaks upward and price level later retraces and retests that new support level, traders will enter long position if price bounces off it.
Combining with Other technical Indicators
Support and resistance levels can be combined with other technical indicators to make trading signals more reliable. For example, traders might use candlestick patterns, oscillators or moving averages to confirm possible entry or exit points near these levels.
It is important to consider that support and resistance levels can provide valuable trading chances and you should also use proper risk management strategies like stop-loss orders and position sizing.
Advanced techniques for Identifying and Trading Support and Resistance levels
Combining advanced technical indicators with classic chart patterns can make support and resistance level analysis more accurate:
Fibonacci Retracement level/Extensions level: Identify a recent swing high and low, then apply fibonacci tool to draw retracement levels. These levels often align with important support/resistance zones, which provide traders potential entry and exit points.
Volume Analysis: traders can analyse volume profiles that show them areas of high trading activity related to strong support or resistance levels. Volume spikes at certain prices indicate major interest, making these levels more reliable.
Moving Averages: Incorporate moving averages while analysis to spot dynamic support and resistance levels. For example, a 200-day moving average can act as strong support in an uptrend and resistance level in downtrend.
Chart Patterns: Patterns like head and shoulders, double tops and double bottoms can indicate potential reversals at support/resistance level.
Using Fibonacci Retracement and Extensions
Fibonacci Retracements and Extensions Level are tools that help traders identify dynamic support and resistance level:
Retracement levels: retracement levels help spot potential pullback points within a trend. Common retracement levels are 23.6%, 38.2%, 50%, 61.8%. Traders use these levels to enter trades during pullbacks in a trend.
Extensions level: Extensions level is used to predict where prices might move after a breakout. levels such as 161.8% and 261.8% provide a potential target for price fluctuations beyond initial trend.
Incorporating Volume Analysis
Volume analysis is important for confirming strength of support and resistance levels:
- Volume Spikes: High trading volume at certain prices indicates strong interest, making these levels more important as support or resistance.
- Volume Profile: It shows distribution of volume across different price levels, helping traders spot essential areas where price are likely to react.
Challenges and Considerations
The Dynamic Nature of Support and Resistance Levels and the Challenge of Accurately Identifying These Levels
Support and resistance levels shift with market conditions. This dynamic nature of these levels poses a challenge for traders trying to identify them accurately. Market volatility, news events and trader sentiment changes can cause established levels to move.
The Importance of Combining Support and Resistance Analysis with Other Trading Tools and Indicators for Better Decision-Making
Relying only on support and resistance levels can be risky for traders. To improve accuracy, traders should combine them with other technical indicators and tools. For example, moving averages, volume analysis and oscillators like RSI (relative strength index) can provide extra confirmation of potential support and resistance zones. This multi-layered approach wiil help traders filter false signals and make inform decisions.
False Breakouts and Whipsaws
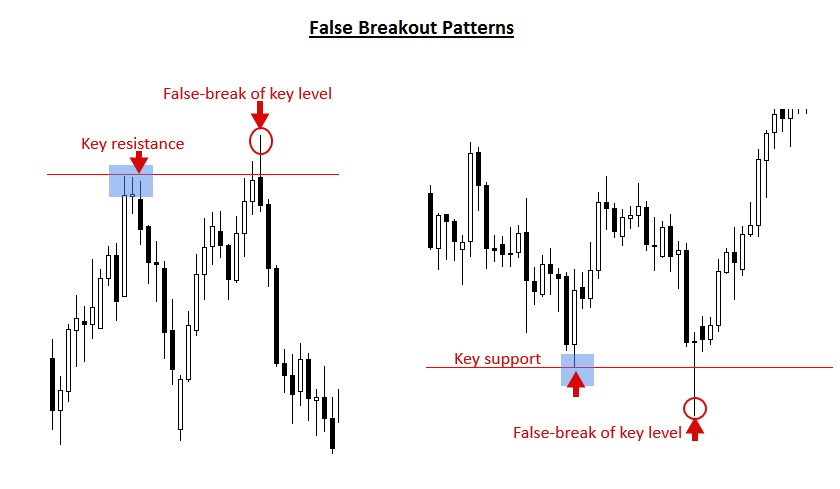
When a price level temporarily passes through support and resistance levels and reverses,is known as false breakout. This traps traders who entered trades based on breakout. These false signals can cause big losses. To avoid this, traders should look for confirmation before entering trades. False breakout risk can be minimized, for example, by waiting for a candlestick to close above the level or using volume analysis to confirm breakout.
Strategies to differentiate between Real vs False Breakouts
To distinguish between genuine breakouts and false ones, traders can use these techniques:
- Volume Confirmation: Genuine breakouts often have increase in tarding volume. Low volume in breakout may signal false move.
- Retest of the level: Waiting for price level to retest broken support and resistance level can confirm validity. If level holds on retest then breakout is valid.
- Multiple Timeframe analysis: Analyzing breakouts across daily/weekly charts can help traders confirm their validity. Breakouts on multiple time frames are more reliable than those on shorter timeframe.
Conclusion
Learning and practicing support and resistance levels is very important for trading. These levels assist traders in spotting potential entries and exits, controlling risk and making smart choices. Traders can use support and resistance analysis with other technical indicators while keeping awareness of market psychology, which can enhance their trading strategies. By trading with demo accounts and constantly improving your skills, you can gain confidence in your ability to utilize support and resistance levels effectively.