Stock quotes are important tools for investors and traders that provide real-time information on a company’s stock price and trading activity.
Learning what stock quotes are, is necessary for making smart investment choices for investors. A stock quote typically shows the current price, bid and ask prices, trading volume and other key metrics that indicate market sentiment for a particular stock.
This article explains why stock quotes are important for trading and investing and what components they usually contain.
What are stock quotes?
A stock quote is a real time indication of key trading information for a specific stock or security. It gives investors and traders current data to help them decide whether to buy or sell shares.
Stock quotes include important information like price the stock currently trades at, how much its value fluctuates (volatility) and how many shares are being traded. By reviewing this information, investors can recognize market sentiment, observe supply and demand dynamics and spot potential trading opportunities.
Ultimately, stock quotes are a critical tool for investors to stay up to date about market conditions and make timely investment choices aligned to their financial goals and risk tolerance. If you invest in stocks, understanding what stock quotes are is a must to manage the stock market effectively.
Basic Components of a Stock Quote
Stock quotes give investors crucial details about a specific stock to make smart trading decisions. Learning about the components of a stock quote is important, whether you’re a new or expert trader. Let’s check out the main elements typically found in a stock quote which are:
Ticker Symbol
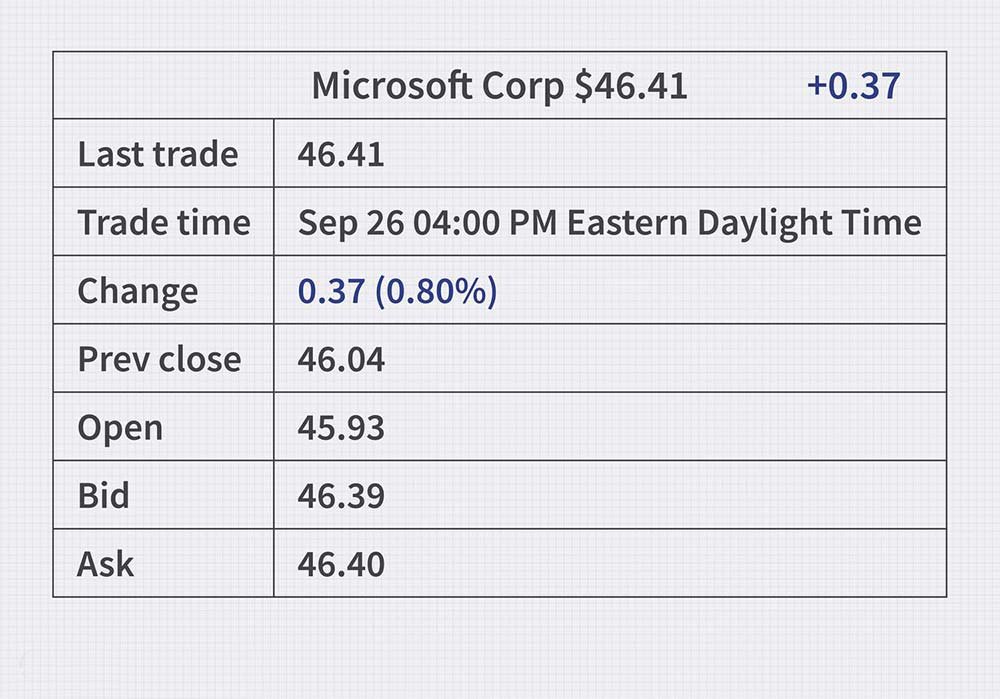
The ticker symbol is a unique letter combination that identifies a specific stock. It’s usually 1-4 letters representing the company name. For example, Apple’s symbol is AAPL, while Microsoft Corporation’s is MSFT. The ticker symbol makes it easy for traders to search for and track stocks.
Last Traded Price
Last traded prices show the latest price of the stock at which it was bought or sold. This price updates throughout the trading day as transactions occur, so investors can gauge the current market value.
Bid and Ask price
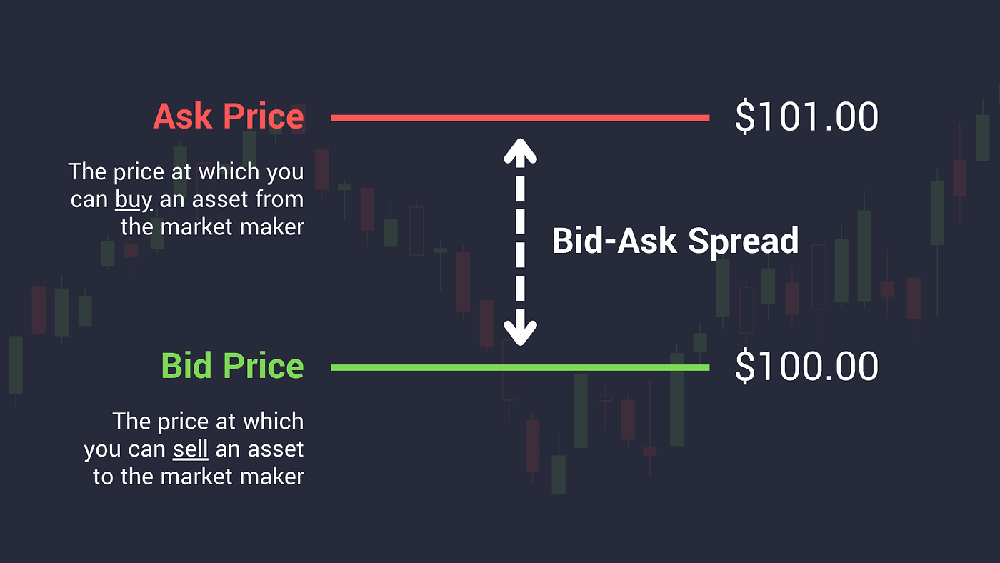
The bid price is the highest price a buyer will pay for a stock, while the ask price is the lowest price a seller will take for a stock.
The difference between these prices is called the spread. A smaller spread generally signals higher liquidity for stocks.
Volume
Volume refers to the total number of shares traded in a day or in a particular time period. It indicates the level of attention and activity around a specific stock. Higher trading volumes often mean more liquidity and easier execution of trading.
High, Low, and Close Prices
The high and low prices show the highest and lowest prices the stock traded at during a given period, usually a trading day.
The close price is the final traded price of stock when the market closed on the previous trading day. These prices help investors see the trading range of stocks and gauge their volatility.
Change
Change shows the difference between the current trading price and the previous day’s closing price. It can be a dollar amount or percentage. A positive change means the price has increased, while a negative change means the price has decreased.
Security Name
The security name shows the official company name offering the stock. It helps investors identify the actual asset they’re trading.
Besides the basics, stock quotes can also include extra data like price-to-earnings (P/E) ratio, market capitalization, dividend yield and 52-week high and low prices. These additional details give a more complete overview of the stock’s performance and financial health.
For people interested in seeing these components in action and understand how they change over time, our guide “What are Stock Price Charts and How to Read Them” gives an in-depth look at interpreting all this stuff visually with charts.
It’s crucial to monitor stock quotes regularly and combine them with other financial metrics and market news to shape a solid investing strategy
Practical Examples
Let’s check out a supposed stock quote for the well-known company Meta (formerly Facebook) with the ticker symbol META. Here’s a breakdown of the main components:
- Ticker Symbol: META
- Last Price : $234.50
- Bid Price: $234.45
- Ask Price: $234.55
- Day’s High: $235.75
- Day’s Low: $233.20
- Volume: 25,678,900 shares
Interpreting this data, Meta stock last traded at $234.50 per share. Buyers will pay up to $234.45, while sellers will take at least $234.55. The stock ranged between a high of $235.75 and a low of $233.20 for the day, with a total volume of over 25 million shares exchanged.
Tools to Access Stock Quotes
There are various platforms and tools available to access real-time stock quotes, which are:
Online Brokerages Platform
Online brokers like Fidelity, Charles Schwab and ETRADE provide real-time stock quotes and detailed stock data to their clients. These platforms feature user-friendly interfaces, advanced charting tools and easy order execution from the quote page..
Financial News Websites
Websites like Yahoo Finance, Google Finance and CNBC offer free, real-time or slightly delayed stock quotes. These sites provide a quick summary of current trading information.
Stock Market Apps

Mobile apps like Robinhood, Webull and TradingView provide investors with access to real-time stock quotes and specific price movement alerts. These apps enable convenient market monitoring while on the move.
Investment Research Tools
Paid platforms like Bloomberg Terminal, Thomson Reuters Eikon and FactSet give institutional investors a complete overview, real-time stock data and advanced research capabilities.
Advanced Features in Stock Quotes
Detailed stock quotes can include extra elements, providing more financial health and performance insights into the company. Some advanced features are:
- Market Cap: Market cap is the total market value of a company’s outstanding shares, calculated by multiplying current stock price by total number of shares.
- P/E Ratio: The price-to-earnings ratio compares current share price to earnings per share. It is a valuation that helps investors assess relative stock value.
- Dividend Yield: Dividend yield is the financial ratio that shows annual dividend payment relative to stock price as a percentage.
- Beta: Beta is defined as a measure of a stock’s volatility compared to the overall market. If value of beta is greater than 1, it means it is more volatile, while if value is lower than 1, it means it is less volatile.
- 52-Week High/Low: The highest and lowest prices at which the stock traded over the past year show the stock’s trading range and volatility..
Practical Tips for Using Stock Quotes

Here are some tips for effectively using stock quotes for trading and investment decisions:
- Monitoring stock quotes regularly is important for active trading. Watch prices movements, volume and other key metrics to spot opportunities or risks.
- For long-term investment analysis, check historical stocks quotes to evaluate company performance over time. Look for trends, patterns and key events that could impact future growth.
- Set price alerts based on stock quotes to stay on top of major movements in your portfolio or watchlist. Many trading platforms and apps offer customizable alerts.
- Combine stock quote analysis with other research like financials, news and market sentiment to get a comprehensive overview of a company’s prospects. Don’t rely solely on stock quotes for smart investment.
How to Use Stock Quotes for Investment Decisions

Stock quotes give valuable information to make smart investment decisions. By analyzing quotes, investors can:
- Identify buying and selling opportunities based on current prices and trends.
- Compare performance of different stocks within an industry to select better investments.
- Set price alerts to monitor and quickly react to significant stock movements.
- Supplement stock quote data with other research for a comprehensive understanding of a company’s prospects.
Importance of Stock Quotes for Investors
By checking stock quotes, investors can make smart choices by knowing this important factors:
- Compare how different stocks are doing and choose what to invest in based on this data.
- Spot trends and patterns in stock prices to find potential buying or selling opportunities.
- Gauge market sentiment and demand for a particular stock by seeing its popularity with other investors.
- Figure out best entry and exit points for trades based on current market conditions.
By regularly monitoring stock quotes, investors stay informed on their portfolio’s performance and can react quickly to market shifts. This ultimately contributes to their investment success.
Conclusion
Knowing what stock quotes are and how to read them matters a lot for any investor that want to make better stock market decisions.
By getting familiar with the different components of a stock quote and using available tools to access this information, you gain valuable insights into a company’s financial health and performance.
As you keep practicing analyzing stock quotes and combining this data with other research, you’ll get better at navigating the market and working toward your investment goals. Remember, knowledge means power when investing in stocks market.