Stock price charts are important tools for investors and traders in the stock market. These graphical representations show how a stock’s price movement and trading volume change over a given time period and also let people analyze past performance and predict the future trend of the stock market.
The history of stock price charting goes back to the early 1900s when Dow Theory and technical analysis got introduced. Now all sorts of investors use stock price charts to make smart choices, from day traders to long-term investors. To achieve success in stock market, learning how to read and interpret stock price charts is a must.
What’s a stock price chart?

A stock price chart illustrates a stock’s price during a certain timeframe. It shows how the price movement and daily trading volume changed. Stock price charts plot historical price data by using a combination of price, volume and different time periods.
The goal of stock charts is to help investors and traders analyze past performance and forecast future price movements. By studying these charts, traders can better understand market dynamics and make smart choices.
Stock charts have two axes – the vertical axis (y-axis) shows the stock price, while the horizontal axis (x-axis) represents time moving left to right. The charting tool plots stock prices over time across the x-axis, with the newest price plotted on the far right. Stock price charts let you spot trends, support and resistance levels and chart patterns.
Types of Stock Price Charts
Investors use several common stock price chart types to analyze price movements and patterns. Each chart presents the data uniquely, providing different insights into market trends and sentiment.
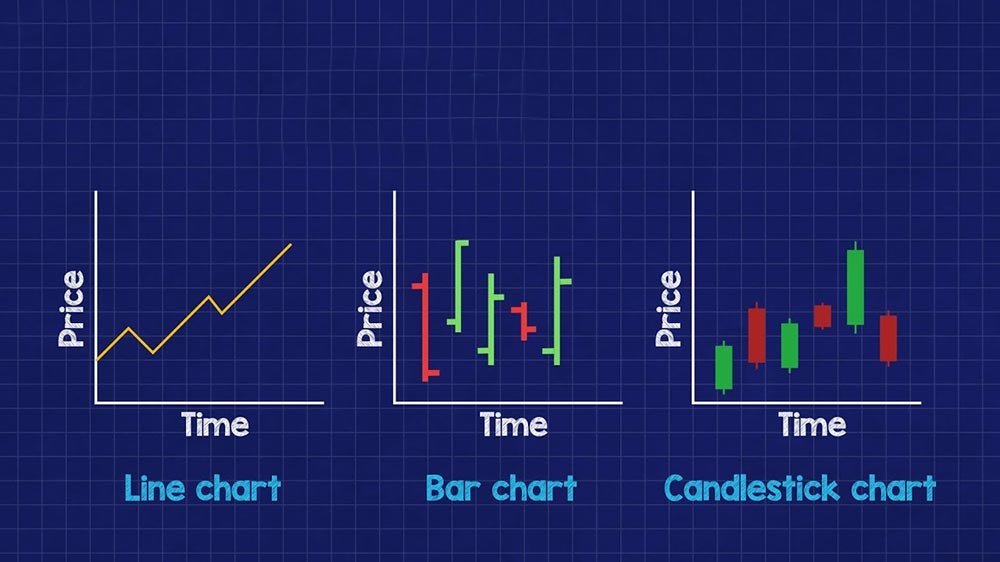
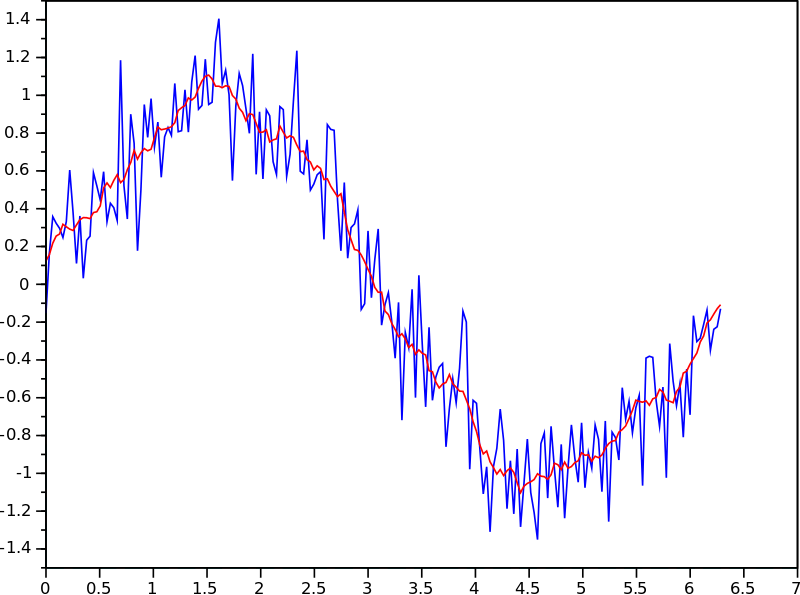
Line Charts
Line charts are the basic type of stock price chart. A line chart shows the closing price of a stock over a particular time period, connected by a continuous line. Although line charts clearly show the general price trend, they do not reveal opening, high, or low prices, which can limit their usefulness for in-depth analysis.
Bar Charts
Bar charts provide more detailed information than line charts. Bar charts show opening, high, low and closing prices for specific time periods like days, weeks or months. The vertical line indicates the price range between high and low, while horizontal lines on the left and right mark the opening and closing prices. Bar charts help identify volatility and compare price action across different time frames.
Candlestick Charts
Candlestick charts, starting in 18th century Japan, have become extremely popular with traders and investors. Like bar charts, candlesticks display open, high, low and close prices for a specific time period.
However, they use unique visual representations, with the candlestick body showing a range between open and close prices and wicks (or shadows) indicating high and low prices.
Candlestick charts work great for spotting price patterns and market sentiment, since the color and shape of each candlestick provide useful insights into tug-of-war between buyers and sellers.
How to Read Stock Price Charts
Effectively reading and interpreting stock charts is important for making smart investment choices. By analyzing price movements, volume trading and key levels, investors can get valuable insights into market trends and potential entry or exit points.
Understanding Price Movements
Price movements on stock price charts provide important information about market sentiment and trends.
- Upward trends, with higher highs and higher lows, suggest bullish sentiment.
- Downward trends, with lower highs and lower lows, suggest bearish views.
Spotting these trends helps investors see the overall movement of a stock’s price.
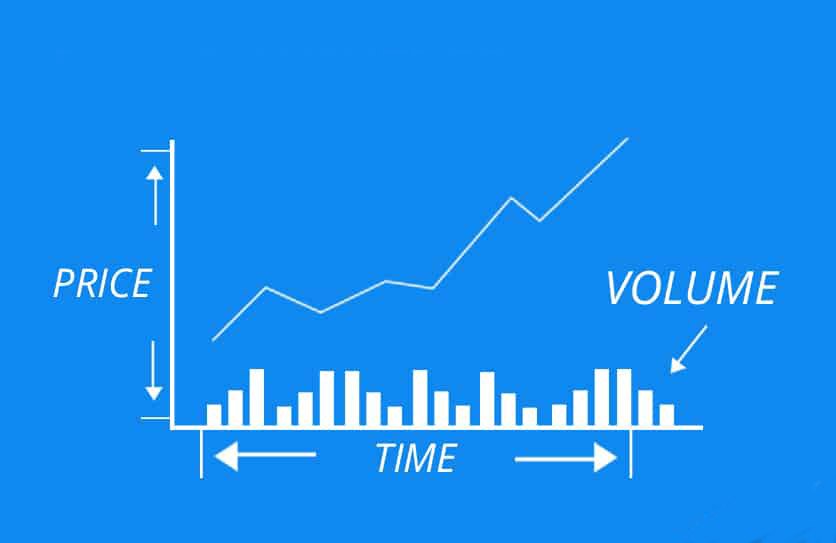
Analyzing Volume
Trading volume is an important component of a stock charts. It shows how much strength and conviction are behind price movement. High volume during a price increase or decrease confirms a strong trend, while low volume may signal a lack of conviction or a potential trend reversal. Checking volume and price action together validates how meaningful price movements are.
Identifying Support and Resistance Levels
Support and resistance levels are important price points where stocks find eager buyers (support) or lots of sellers (resistance). Spot these levels by looking at historical price action, like previous highs, lows and areas of congestion.
By mastering stock charts, investors can better spot market trends, see opportunities and make better decisions.
Key Components of Stock Price Charts
Stock price charts highlight the importance of analyzing price movements and making smart trades. Here are some components, which are:
Price Axis (Y-Axis): The price axis, or y-axis shows the current share price levels of a stock, as this information helps to indicate support/resistance levels and potential entries/exits points.
Time Axis (X-Axis): The time axis, or x-axis shows the time period being analyzed. Stock price charts display the time frame studied – (intraday, daily and weekly etc.), depending on investor trading style and preference.
Volume: Volume shows the number of shares traded in a given time period. High volume means strong investor interest, while low volume suggests weak conviction in the price action.
Chart Patterns
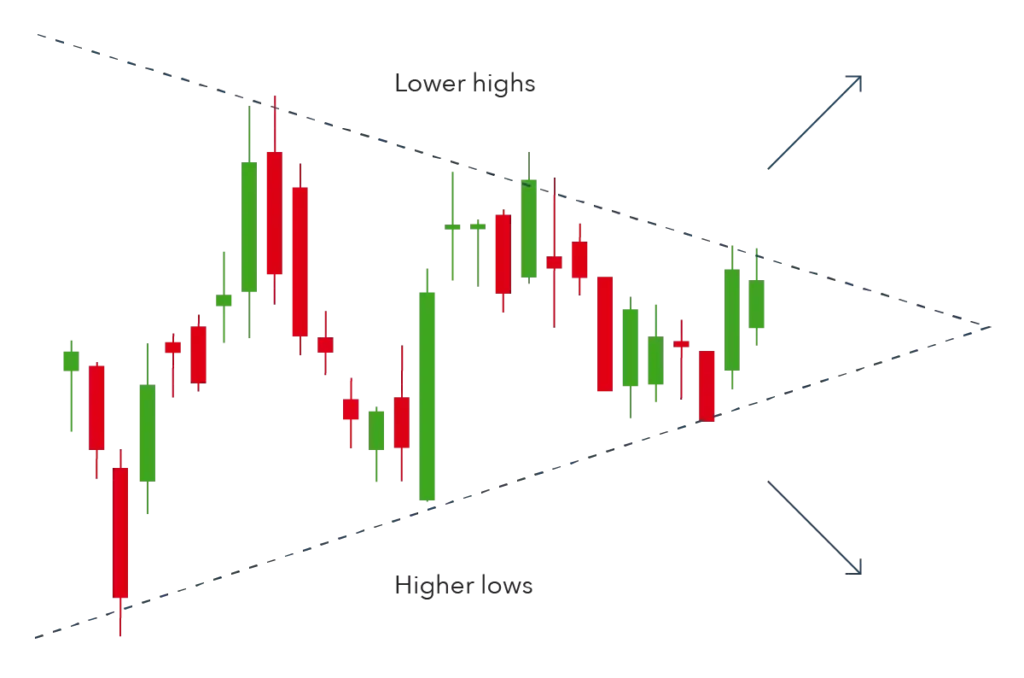
Chart patterns visualize the forces of supply and demand in the stock markets. By analyzing these patterns, investors can see potential trend continuations or reversals and support/resistance levels.
Trendlines: Trendlines are lines drawn to connect major price points and help investors identify the trend direction – uptrend, downtrend or sideways. They mark support and resistance on the stock price charts.
Support/Resistance: Support and resistance levels are horizontal lines that show where prices tend to stop and reverse. They are important for predicting price movement and finding potential entry and exit points for trades.
Common Patterns: Common chart patterns include Head and shoulders, double tops/bottoms, triangles, wedges and flags etc. Each pattern has its own unique traits that signal possible trend reversals or continuations depending on market conditions or other technical indicators.
Technical Indicators and their Use with Stock Price Charts
Technical indicators are mathematical formulas based on historical trading data, like price and volume, that investors use in conjunction with stock price charts to evaluate securities and show trading opportunities. They provide insight into supply/demand and investor market psychology.
Moving Averages
Moving averages are a very important technical indicator that smooths out price data by calculating the average over a particular number of time periods. The two main types of moving averages are the simple moving average (SMA) and the exponential moving average (EMA).
Momentum Indicators
Momentum indicators like the Relative Strength Index (RSI) and Moving Average Convergence Divergence (MACD) help investors evaluate speed and power of price movements. These can identify overbought or oversold conditions and potential reversals.
Volume Indicators
Volume indicators like On-Balance Volume (OBV) and Volume-Weighted Average Price (VWAP) utilize trading volume data to confirm price trends and gauge market sentiment. By analyzing volume with price action, traders can validate the importance of price movements and spot potential turnarounds.
Advanced Chart Patterns
More intricate chart patterns provide useful insights into upcoming trend reversals or continuations in stock price charts. Learning these advanced patterns is necessary for traders to anticipate future price movements.
Head and Shoulders pattern
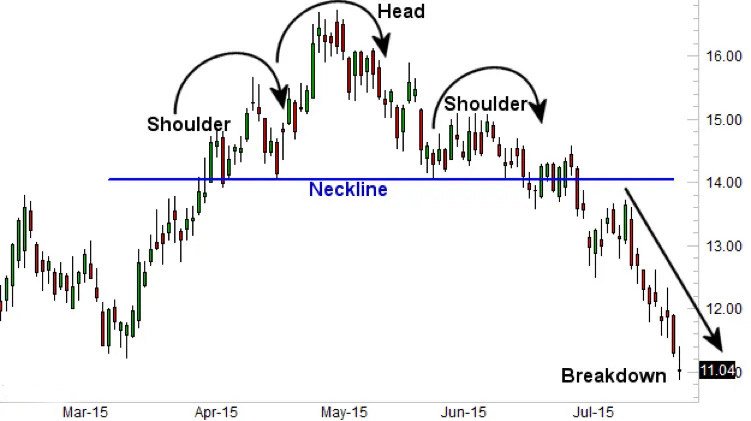
The head and shoulders pattern signals potential bearish reversals that contain three peaks, with the middle peak (the head) being the highest and two outside peaks (the shoulders) being lower and roughly equal. This head/shoulder pattern shows a potential trend reversal from bullish to bearish.
Double Tops and Bottoms
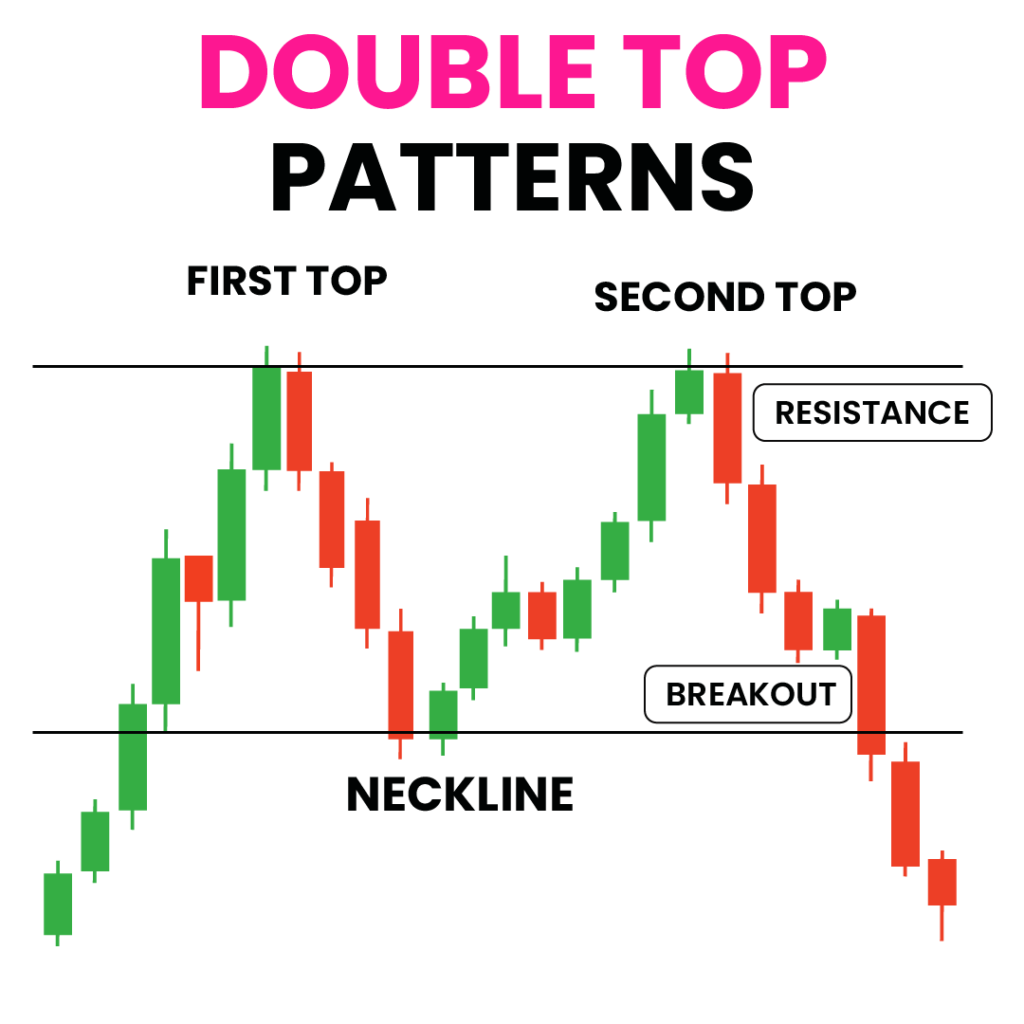
Double tops and bottoms are bearish reversal patterns that indicate trend direction change. Double top forms when price hits high, pulls back, then reaches same high before dropping in “M” shape, while on the other hand, double bottom forms when price drops to low, rallies, then hits the same low before rising in “W” shape.
Triangles and Wedges
Triangle and wedge patterns indicate continuation or reversal when the price range narrows over a time period. Common variations are ascending triangles, descending triangles and symmetrical triangles. Wedges like rising and falling wedges resemble triangles but have converging trendlines. These signal potential breakouts or trend reversals depending on the breakout direction.
Using Stock Price Charts for Analysis
Stock price charts are powerful analysis tools for investment decisions. By studying historical price movements, investors can identify key patterns and signals indicating future direction.
Identifying Trends
Trend analysis crucially uses stock price charts. Examining the overall price direction of price movement, investors determine uptrends, downtrends or moving sideways of a stock. Long-term trends are visible on weekly or monthly charts, while short-term trends are visible on daily or intraday charts.
Spotting Reversals
Reversal patterns like head and shoulders or double tops and bottoms can signal potential changes in trend direction. By recognizing these key markers on stock price charts, investors can get ready for trends to switch and adjust accordingly. Confirming reversals by checking trading volume can provide extra proof.
Setting Entry and Exit Points
Stock price charts help investors pinpoint optimal times to enter and exit trades. By identifying support and resistance levels, traders can plan trades around key prices. Timing your entries and exits using chart patterns and indicators can maximize profits and limit losses.
Conclusion
To sum up, understanding stock price charts is of utmost importance for investing success. By studying how to interpret various chart types, spot key patterns and trends, and use technical indicators, investors can make smarter calls on buying, holding or selling stocks.
While past performance provides useful information, it doesn’t guarantee future outcomes. Still, by combining chart analysis with a strong grasp on market conditions and personal financial goals, investors can deal with the complicated stock market with greater confidence and potentially optimize their returns.
To further increase your knowledge of stock charts and table, we highly recommend our comprehensive guide on “How to Read Stock Tables and Charts”