Volume and market depth are very important for investors and traders to gain insights into market sentiment and liquidity. Volume refers to the total number of shares or contracts traded in a period, while market depth shows liquidity based on open buy and sell orders at different price levels.
Volume and market depth have a long history, which helps traders identify market trends and potential reversals. To achieve success in the stock market, learning about volume and market depth is crucial for making better trading decisions.
What’s Volume?

Volume means the total number of shares or contracts traded in a particular time period, like daily, intraday, or monthly. It is an important sign that confirms trends, signals potential reversals, and indicates interest levels in a security.
High volume points to strong interest, while low volume means lack of interest. Volume provides critical data on market sentiment and liquidity, which helps traders make educated decisions regarding entry and exit points when trading in securities like stocks, options, or futures contracts.
Key Takeaways
- Volume confirms market trends and possible reversals. High volume signals strong interest, while low volume indicates a lack of conviction.
- Volume indicates good entry and exit points for trades. Rising volume in price direction confirms the trend, while falling volume may signal a reversal.
- Volume and market depth provide liquidity insights and ease of trading at desired prices. Higher volume and deeper markets generally have better liquidity and less price impact.
- Analyzing volume patterns with price action can offer insight on market sentiment, spot institutional activity and empower wiser trading choices.
What is Market Depth?

Market depth measures liquidity using the number of open buy and sell orders for a security at different price levels. It shows bid prices, ask prices and order sizes in the order book. Market depth provides insights into the supply and demand dynamics of a security, signaling how much volume is needed to move the price by some amount.
A deep market has many orders at each price level, implying high liquidity and the ability to execute large trades without affecting the price. Market depth helps traders gauge the market’s capacity to absorb volume while keeping prices stable.
Measuring Market Depth
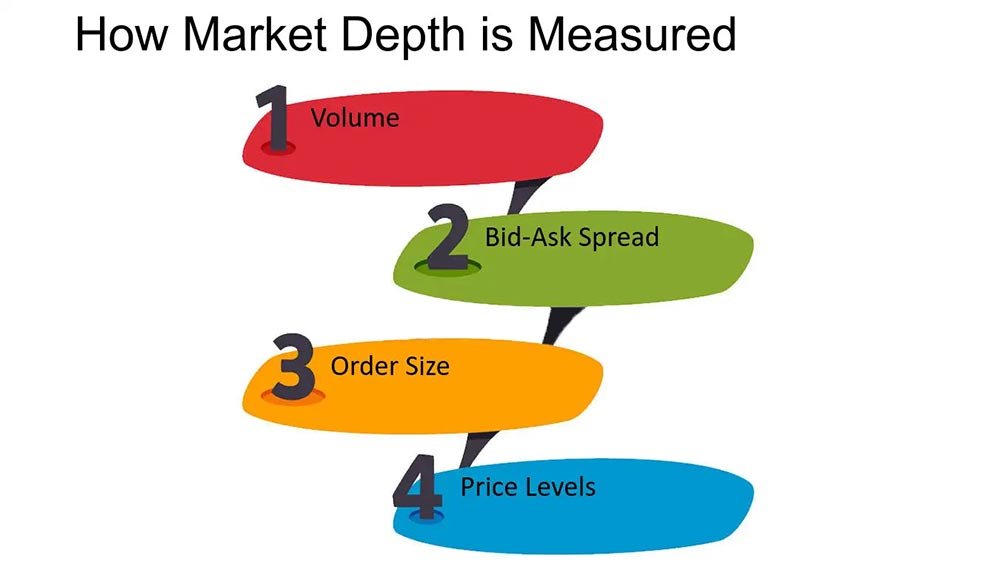
Market depth can be measured by analyzing different aspects of the order book, including:
- Volume: The total number of orders in the limit order book shows overall interest and liquidity.
- Bid-Ask Spread: Bid-Ask spread is the price difference between highest bid price and lowest ask price, which reveals greater market depth and liquidity.
- Order Size: The quantity of orders at each price level, while larger order sizes signal better depth at various price points.
- Price Levels: The number of different price levels with pending orders, while more price levels signal better market depth and orders fall across wider price range.
Related: How to Read Stock Tables and Charts
Significance of Market Depth
Market depth is a crucial signal of market liquidity and potential price movement. It shows whether the market can handle large orders without significantly moving prices. A deep market with high order volumes at various prices suggests stability and liquidity in the market.
Meanwhile, a shallow depth indicates potential volatility and trouble executing big trades without price impacts.
Market Depth Charts
Market depth charts visually show the bid and ask volumes at different price levels, which gives traders a clear snapshot of market depth. These charts help investors spot support and resistance levels and potential trading opportunities.
Reading Market Depth Charts
Market depth charts display the bid and ask levels, indicating the prices at which buyers will buy and sellers will sell an asset. Investors can assess the overall supply and demand dynamics in the market by analyzing these levels.
Interpreting Market Depth Data
You interpret market depth data by analyzing supply and demand patterns at different price levels. This data helps investors spot potential market manipulation, like spoofing and make smart decisions based on true market sentiment. Volume and market depth data can also identify trends and assess possible price movements.
Interpreting Volume and Market Depth
Volume and market depth are important for traders to make smarter decisions. Traders can spot trends, market sentiment and potential reversals by analyzing volume data. High volume during price fluctuations suggests a strong trend, while decreasing volume may indicate a potential reversal.
Analyzing Volume Data
- Identifying trends and sentiment: Rise in volume in direction of a price move suggests strong trends, while falling volume suggests a lack of conviction.
- Volume spikes and dips: Huge volume spikes can signal a potential trend of collapse or reversals, while volume drops mean decreased demand.
- Volume patterns: Analyzing volume patterns like accumulation or distribution phases provides a preview of the potential trend, whether it will continue or reverse.
Order Flow Analysis
- Order flows: Evaluating flows of buy and sell orders spots institutional money moves and gauges market liquidity.
- Support and resistance: Order flow analysis identifies strong support or resistance zones based on concentrations of orders at specific price levels.
- Market liquidity: checking the depth of order book and size of orders, which helps investors reveal the market’s capacity to absorb big trades without huge price fluctuations.
Level 2 Data
- Detailed view: Level 2 data shows a granular view of all open orders for a stock, including market maker ID, price and size.
- Supply and demand: Level 2 data helps traders spot areas of high supply and demand along with potential support and resistance levels depending on the concentration of orders.
- Using Level 2 data: Traders leverage Level 2 data to make smart decisions about entries and exit points, as well as to assess market sentiment and liquidity.
Practical Applications in Trading
Using Volume to Confirm Trends
Volume analysis is important for confirming trends When prices move in the trend direction along with rising volume, it shows a strong trend. Conversely, a decrease in volume during a price fluctuation might signal a potential trend reversal or weakening of momentum.
Volume and Price Breakouts
Volume helps traders identify and trade breakouts more accurately. A big change in volume during a price breakout above or below an important support or resistance level can signal the start of a new trend. Traders look for breakouts with high volume as proof of the breakout’s validity.
Market Depth and Trade Execution

Market depth is important for optimal trade execution and traders use market depth data to evaluate liquidity and the potential impact of their orders on the market price. Traders determine the right order size and execution strategy to minimize slippage and get better entries and exit points by analyzing order book depth.
Tools to Analyze Volume and Market Depth
To effectively analyze volume and market depth, investors utilize various tools and platforms that require real-time data and visualization. Here are some tools, which are:
Level 2 Data
Level 2 shows all open orders at different price levels, like market maker ID, price and order size. This detailed overview of the order book helps investors spot potential trades, market sentiment and liquidity levels.
Depth Charts
Depth charts visually display bid and ask volumes across different price levels. They offer a graphical representation of buy and sell orders, allowing traders to immediately assess market depth and liquidity.
Volume Indicators
Volume indicators like On-Balance Volume (OBV), Volume Oscillator and Chaikin Money Flow combine price and volume data to signal buying or selling pressure, reversal potential trends and market momentum.
Advanced Trading Techniques
Combine Volume and Market Depth Analysis
Volume and market depth analysis give traders a better grasp of market dynamics. By mixing insights from volume patterns, order flow analysis and market depth data, investors can make smarter choices about entry and exit points, position sizes and risk management.
Volume and Depth Behavior in Different Markets
While the core principles of volume and market depth analysis work across different markets, these nuances matter when trading different asset classes.
For example, forex markets may show different volume patterns than stock markets, while cryptocurrency markets could have unique liquidity behaviors. Specific market traits are important for successful trading by adapting volume and market depth analysis techniques.
Limitations and Challenges

Limitations of Volume Analysis
Though they provide valuable insights, volume and market depth analysis have certain limitations, which are:
- Inaccurate or incomplete data in specific markets can misleadingly indicate or cause misinterpretations.
- Volume analysis has restricted forecasting abilities and signals may not translate into accurate predictions.
- The rise of high-frequency trading and algorithmic trading can distort volume patterns, making them tougher to decipher.
Limitations of Market Depth Analysis
- Decentralized markets like forex mean market depth data may not accurately represent entire market.
- “Spoofing,” where large orders are placed and then quickly drawn, manipulates market depth perception and can misguide investors.
- For highly liquid markets, depth data becomes less relevant as large orders get rapidly absorbed without impacting prices.
Conclusion
To sum up, analyzing volume and depth is vital for informed trading decisions in the financial markets. The relationship between volume, price movement and market depth helps investors identify trends, reversals and gauge market sentiment.
Volume confirms trend strength and provides insights into market participation, while market depth reveals the market’s absorption ability for large orders without significant price impact.
Integrating volume and market depth analysis with other indicators and fundamental analysis improves strategies and risk management, enabling successful trading outcomes.