An important thing to know before making any investment is how to read stocks. Stock charts give important insights into how a company is doing and broader market trends. By learning how to interpret the data in stock charts, investors can spot potential opportunities and risks. This will lead investors to make informed decisions.
Understanding Stock Charts

Stock charts visually show a company’s stock price over time. They play a big role in stock analysis by giving investors critical details about price changes, trading volume, and market trends. Knowing how to read stocks on these charts is key for making good choices.
Types of Stock Charts
Investors and traders use three main types of stock charts to track performance and identify trends:
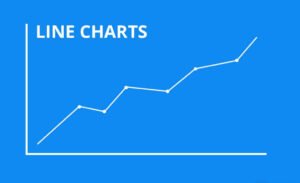
Line Charts: Line charts are the simplest stock chart type. Line charts display the closing stock price over a defined period. They provide a clear picture of overall price movement, making spotting trends straightforward. But line charts don’t show intraday price fluctuations.
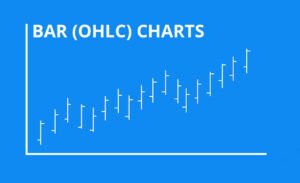
Bar Charts: Also called OHLC charts. Bar charts showcase the opening, high, low and closing prices for each trading timeframe. Every bar marks one timeframe. Vertical lines mark the high and low prices. Short horizontal lines on both sides indicate the open and close prices. Bar charts have more detail than line charts but can look messy.
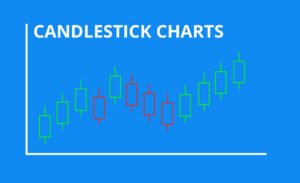
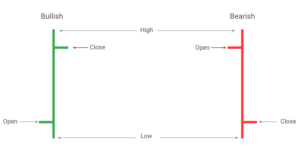
Candlestick Charts: Similar to bar charts, candlestick charts also display OHLC information – but in a visual format. Each “candle” represents one trading period. The body shows the open-to-close range. “Wicks” indicate the high and low prices. Upside moves are usually green/white, downside red/black. Many traders favor candlesticks since they clearly highlight market sentiment.
When learning how to analyze stocks, it’s helpful to get familiar with these chart types and what insights they offer. Looking at price data over different timespans and combining discoveries from multiple chart types gives investors a fuller picture of a stock’s journey.
The Key Pieces of Stock Charts
To really understand stock charts, you need to know these core parts:
- The Price and Time Axes: The x-axis shows time, while the y-axis displays the stock price. This allows you to see how the price has moved over a certain timeframe.
- Volume Bars: Found below the chart, these bars indicate the number of shares traded during set time periods. High volume suggests strong conviction in price shifts.
- Moving Averages: These lines average out prices over chosen periods to smooth out the data. They identify trends and potential support/resistance points.

Must-Know Stock Chart Vocabulary
| Word | Definition | Why It Matters |
| Open | Starting price that day. | Shows market sentiment and potential direction. |
| High | Highest price that day. | Indicates maximum reached and resistance points. |
| Low | Lowest price that day. | Reveals minimum reached and support levels. |
| Close | Final price that day. | Reflects ending market sentiment for analysis. |
| Volume | Total shares traded that day. | Confirms price moves and interest. |
| Market Cap | Total value of outstanding shares. | Helps determine company size and risks/rewards. |
| Moving Average | Average price over x periods. | Identifies trends and support/resistance zones.. |
| Trend | General price direction over time. | Shows if price is rising, falling, or sideways. |
| Support | Where buyers come in, price bounces up. | Indicates potential price floor. |
| Resistance | Where sellers take over, price falls back. | Shows possible price ceiling. |
Learning these basic terms helps investors better understand the information represented in the charts to make informed choices.
Next-Level Stock Chart Terms
| Word | Definition | Why It Matters |
| Bid and Ask | Highest price a buyer will pay (bid), lowest a seller will take (ask). | Shows supply/demand and potential price shifts. |
| Beta | Volatility measure compared to the whole market. | Helps assess risk and possible rewards. |
| EPS (TTM) | Earnings per share over the last 12 months. | Provides profitability insight, used to calculate P/E ratio. |
| Ex-Dividend Date | Date you must already own stock to get next dividend payout. | Key for income investors relying on dividends. |
| 52-Week High/Low | Highest and lowest prices in the last year. | Helps gauge current price relative to recent range. |
| RSI | Relative Strength Index, measures price momentum and speed of changes. | Spots overbought/oversold conditions and trend reversals. |
| MACD | Moving Average Convergence Divergence, shows relationship between moving averages. | Reveals changes in trend strength, direction, duration. |
Getting to know and understand these more advanced terms assists investors in better understanding stock charts when learning how to analyze stocks. Combining basic and advanced concepts provides a fuller picture of past performance and where prices could be headed next.
Interpreting Stock Chart Data
Being able to read stock charts is important for investors to make informed choices. By analyzing the data in these charts, you can spot trends, patterns, and signals that provide useful info about a stock’s performance.
Opening, High, Low, and Closing Prices
It’s extremely important to know the significance of each price point when reviewing charts. The opening price is the first trading price that day, while the closing price shows where things ended up. The high and low indicate the trading range that day.
Studying how these four prices relate, gives insight into the stock’s overall momentum and sentiment. For example, if a stock consistently closes near its high, it could signal strong bullish feelings. But if it keeps closing near the low, that may suggest bearish environment.
Comparing opening and closing prices also provides valuable details. If the stock finishes way above its starting point, it shows buyers controlled that session. But if it closes far below its open, sellers were likely in charge.
Analyzing OHLC over time helps investors identify trends and know better when to buy or sell. Analyzing and understanding this data is key for effectively learning how to read stocks.
Market Capitalization
Market cap refers to a company’s total value based on shares out there and current price. It’s calculated by multiplying outstanding shares by the price per share. Market cap can impact volatility and overall investment risk.

Larger cap stocks tend to fluctuate less drastically than smaller caps. That’s because large caps are typically established players with stable revenue and cashflows, making them potentially safer. But they may offer less growth potential.
Smaller caps meanwhile can be more volatile as newer companies with less predictable finances but possibly bigger growth ahead. These may provide higher returns but also come with more risk.
Knowing a company’s market cap helps make investments choices based on risk tolerance and goals. It’s wise to diversify across caps to balance risk and reward potential. Market cap should be considered along with other factors like financials, industry trends and market conditions.
Trading Volume
Trading volume refers to the total shares or contracts exchanged during a certain period. It offers valuable insight into market interest and liquidity for a stock.
High volume signals lots of buyers and sellers, indicating strong interest. Rising volume during an uptrend confirms bullish feelings, while increasing volume during a slide backs up bearishness.
Investors often look at volume to validate price movements and assess the power behind a trend. To effectively read stocks, you need to understand the link between price and volume, and figure out patterns suggesting if trends might continue or reverse.
Time Interval Selection
Choosing the right timeframe for analyzing charts is crucial, depending on your investing objectives. Here are some pros and cons of different intervals:
Benefits of longer timeframes (weekly, monthly):
- Wider perspective on price action
- Spot long-term trends and patterns
- Less noise than shorter periods
Drawbacks of longer timeframes:
- May miss short-term chances
- Slower to respond to market shifts
Pros of shorter periods (daily, intraday):
- React quickly to market changes
- More detailed price action info
- Suit short-term trading strategies
Cons of shorter periods:
- More noise and volatility
- False signals from short-term swings
Generally, combining timeframes is best to comprehensively view performance. Long-term investors might focus on weekly and monthly charts, short-term traders on daily and intraday. Analyzing multiple periods this way helps understand the bigger trend to better read stocks.
Technical Indicators and Patterns
Technical indicators and patterns are essential chart analysis tools to forecast future price movements. Two commonly used indicators are moving averages.
Moving Averages
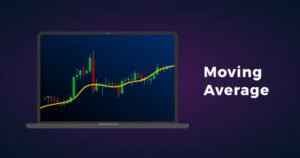
Moving averages smooth out price data by creating an ever-changing average over a set period. The two main types are:
- Simple Moving Average (SMA): The basic arithmetic mean of prices over x periods.
- Exponential Moving Average (EMA): A weighted average prioritizing recent prices for quicker reaction time.
Here’s a comparison of SMAs vs EMAs:
| Feature | SMA | EMA |
| Calculation | Arithmetic mean | Exponentially weighted average |
| Sensitivity to recent data | Low | High |
| Lag time | More | Less |
| Best use | Identify long-term trends | Spot short-term trends |
Traders use moving averages to spot trend direction, find support/resistance levels, and generate trading signals. For example, a bullish crossover happens when a faster EMA crosses above a slower EMA, hinting at a potential buying point.
Understanding how to read stocks with moving averages assists investors in making informed decisions aligned with the current market trend. But other indicators and analysis should complement them.
Support and Resistance Levels
The main price points where a stock face an upward or a downword pressure are support and resistance levels. Support levels act as a floor, underpinned by adequate demand to avoid further decline. Resistance is the opposite to support. It is a ceiling where supply prevents any more gains.
To identify these levels, look for areas where the price has repeatedly bounced off or struggled to push past. These zones can be horizontal or sloping depending on the trend. As the price approaches one, it may bounce off or break through, signaling the next possible move.
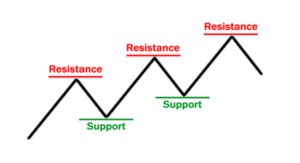
Understanding how to find these support and resistance levels facilitates investors in knowing when to buy or sell stocks depending on how the price moves in relation to these levels.
Chart Patterns
Chart patterns are visual price formations that can point potential moves ahead. Learning to recognize patterns helps investors make informed trades. Some common examples are:
Head and Shoulders
This resembles a head with shoulders on either side, typically represents a trend reversal ahead, with prices expected to shift direction after the pattern completes.

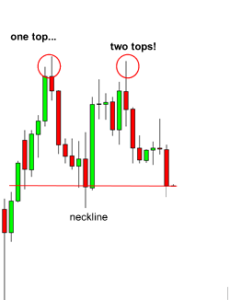
Double Tops and Bottoms
Double tops happen when prices reach a peak twice with a moderate dip in between. Double bottoms form the opposite way, with two low points and a rise between. These often precede trend reversals.
Triangles
Triangles emerge when the price range narrows over time and the highs/lows converge. Ascending, descending and symmetrical triangles can predict trend continuations or reversals, depending on context.

Spotting patterns is key technical analysis. Combining with other indicators and fundamentals provides a more complete view of future stock moves.
Fundamental vs. Technical Analysis
Fundamental and technical analysis take different strategies for reading stocks. Fundamental analysis focuses on financial health, growth potential and intrinsic value by examining revenue, earnings, market share etc. to see if a stock is under/overvalued.
In contrast, technical analysis studies price/volume history to spot patterns and trends signaling future movements. Technicians use charts, indicators and formulas to assess strength/weakness and make trades accordingly.
While fundamental analysis better suits long-term investing, technical analysis aids short-term trades. Still, many investors blend both for a more complete picture. Fundamentals identify promising stocks, technicals determine optimal entry/exit points. Applying both strategies leads to more informed choices and potentially improved returns. Ultimately, understanding fundamental and technical analysis provides a more holistic approach on how to analyze stocks and invest in them.
Practical Tips for Reading Stocks
If you’re new to stocks, here are some tips to help you better understand these stock charts.
- Line charts are a good starting point to spot basic trends. By showing a simplified price timeline, they clearly highlight when a stock is generally moving up or down.
- Check the volume to confirm if a price change is solid. Increasing volume on upward days (and decreasing volume on downward days) indicates strong momentum.
- Moving averages help identify the current trend’s direction. Plotting 50-day and 200-day moving averages can signal if a stock is rising, falling or moving sideways.
- Notice price levels where buying or selling may happen. Key support and resistance levels often mark where a stock has previously faced significant buying pressure or selling pressure.
- Learn to recognize patterns for potential signals. Common chart patterns like head and shoulders or triangles may suggest a coming trend reversal or continuation.
- Use multiple timeframes to see the full picture. Analyzing daily, weekly, and monthly charts provides a more complete understanding of price performance.
- Practice regularly and keep educating yourself. Consistently analyze charts over time and stay updated on new techniques. This is most important step for mastering technical analysis.
Remember—learning how to analyze stocks takes patience and perseverance. But with ongoing experience, you’ll start noticing more insightful patterns and trends in the charts!
Conclusion
In this blog-post on how to read stocks, we looked at stock chart essentials—the different chart types, key parts like OHLC prices, market cap, volume and time intervals. We also talked about analyzing the data through indicators like moving averages and chart patterns. Combining this technical analysis with fundamental analysis gives investors a fuller view of a stock’s performance. To start effectively, focus on spotting trends, confirming movements with volume, using moving averages and recognizing common patterns. With continuous practice of these important basic skills, and an enthusiasm for ongoing learning, readers can become more adept stock chart analysts over time.