Technical indicators are key for traders and investors when it comes to figuring out where the market is heading. They dig through past and current price action and volume to help make smart decisions.
We will go over some of our top picks for the best technical indicators for stock trading.
Overview and Significance
Think of technical indicators as math-powered tools that peek into market behavior by studying old price and volume data. They’re super valuable for anyone looking to spot market trends, check out momentum, and find good times to jump in or out of a trade.
The best technical indicators for stock trading shine a light on what’s happening in the markets, reducing guesses and emotional decisions.
These tools are game-changers for several reasons:
- They’re great at tracking trends, showing when markets might be shifting from bullish to bearish (or vice versa), pointing out when prices might flip, and catching changes in trading volume.
- With technical analysis tools, traders can craft strategies that fit how much risk they’re willing to take and their investment aims.
- Favorites like Moving Averages (MA), Relative Strength Index (RSI), and Moving Average Convergence Divergence (MACD) come in handy for understanding market swings and getting into momentum trading.
Top Technical Indicators for Stock Trading
Below we will look at some of the best and most widely used technical indicators in the trading industry.
Moving Averages (MA)
First up, we’ve got Moving Averages (MA). Moving Averages are at the forefront when it comes to figuring out where a stock’s price might head next. What they do is pretty simple: they calculate the average price of a stock over a certain time frame to help smooth out all that daily price jumpiness. This makes spotting trends way easier.
There are two main versions we look at: Simple Moving Average (SMA) and Exponential Moving Average (EMA).
Simple Moving Average (SMA)
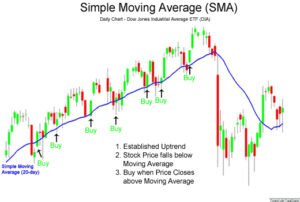
With SMA, it’s all about taking an average of how a stock has closed over a certain number of days. It’s pretty straightforward and works well if you need a quick look at price trends during that period.
Exponential Moving Average (EMA)
Then there’s EMA, which values recent prices above historical ones. So, it puts more weight on what’s just happened. This makes EMA great for those who want to follow trends as soon as they start to appear.
Comparison Between SMA and EMA
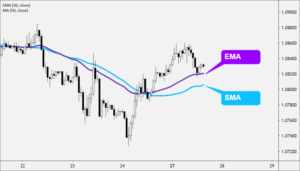
| Feature | SMA | EMA |
| Weighting | Equal for all prices | More weight to recent prices |
| Responsiveness | Less responsive to new price changes | More responsive to new price changes |
| Best Used For | Long-term trend analysis | Short-term trading and identifying early trend changes |
Both SMA and EMA are vital if you’re trying to figure out market analysis. They can point you to trends, help you see where trading signals might be hiding, and suggest good spots to enter or exit trades—perfect tools whether you’re planning short-term moves or looking further down the road.
Moving Average Convergence Divergence (MACD)
The Moving Average Convergence Divergence (MACD) is a go-to for anyone looking into stock trading indicators. It gives you a detailed look at where the market might be heading by tracking momentum and trends.
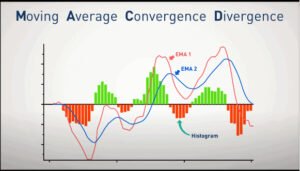
It functions as follows: it uses two lines based on exponential moving averages (EMAs) and shows the difference between them in what’s called the MACD histogram.
- MACD Line: You get this by taking away the 26-period EMA from the 12-period EMA.
- Signal Line: This one’s a 9-day EMA of the MACD line and helps flag possible buy or sell chances.
- Histogram: Shows how far apart the MACD line and Signal line are, hinting at whether we’re seeing more buying or selling pressure.
Usage:
- Crossovers: If the MACD line crosses over above the signal line, that’s a thumbs up for bullish vibes. A crossover below? Watch out, things might be turning bearish.
- Divergences: Spotting a divergence is like finding a clue about future price moves. If prices drop to new lows but the MACD doesn’t, bulls might be getting ready to charge. And if prices shoot up but the MACD isn’t feeling it, bears could soon take over.
- Histogram Changes: Watching which way the histogram’s trending can give you an early indication on momentum shifts. An increasing histogram suggests growing momentum, while a decreasing histogram may indicate momentum fading.
Therefore MACD isn’t just another tool; it’s key for spotting changes in momentum and trend directions.
Relative Strength Index (RSI)
The Relative Strength Index (RSI) is also one of the key trading indicators. It measures how fast prices are changing, comparing recent upswings to downturns to gauge if an asset might be ready for a change in direction.
How It Works
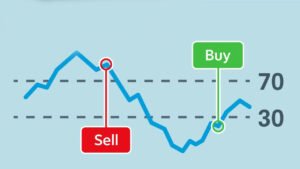
By processing some numbers through a specific formula, the RSI gives us a value between 0 and 100. If you see an RSI over 70, that usually means the asset’s been bought too much (overbought). And if it’s under 30, it likely means the opposite – it could be oversold.
How Traders Use It
- Overbought/Oversold Conditions: The RSI helps traders figure out when a stock’s price is too high (overbought) or too low (oversold), which can hint at an upcoming flip in price.
- Divergences: If a stock’s price is heading one way and the RSI another, that’s called a divergence. It could mean things are about to change direction. A bullish divergence happens when prices drop to new lows while the RSI starts climbing – suggesting prices might start rising soon. On the flip side, bearish divergence occurs when prices hit new highs but the RSI falls, possibly pointing to an upcoming price drop.
- Centerline Crossovers: With 50 as its middle marker, anything above this in the RSI suggests growing trends (bullish), while below indicates declining trends (bearish).
- Failure Swings: This refers to moments where the RSI exits overbought or oversold areas and then sets either higher lows or lower highs than before—without matching moves in the actual prices—a strong nudge towards a market turnaround.
While great for markets without clear directions, remember that RSI is most effective when paired with other technical analysis tools for double-checking those trading signals.
Bollinger Bands
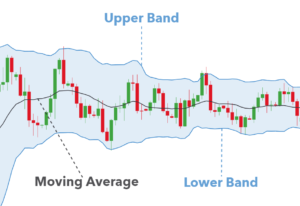
Bollinger Bands stand as key tools in stock trading, making sense of market changes and where prices might head next. John Bollinger introduced them in the 1980s. They include a simple moving average (SMA) surrounded by two lines that measure standard deviations—one above (upper band) and one below (lower band) the SMA.
Bollinger bands widen or narrow with the market’s volatility, shedding light on whether stocks are overbought, oversold, how strong a trend is, and when prices might shift significantly.
- Upper Band: This line shows us when things might be getting too hot (overbought).
- Middle Band (SMA): Acts as our guide for figuring out which way the market is trending.
- Lower Band: It tells us when things might be going down too much (oversold).
Key Points On Usage:
- Volatility: A look at how far apart the bands are can tell us if the market is calm or wild.
- Trend Identification: If prices keep touching the upper band, it could mean we’re in for more ups. And if it is near the lower band, it may indicate that downs are on the way.
- Bollinger Squeeze: When those bands get close together, prepare yourself because it often means a big price move is on its way.
- Bollinger Bounce: Prices tend to swing back towards the middle SMA after hitting a band, useful for trades in markets that aren’t picking a clear direction.
With their ability to adapt to different financial instruments and fit into various trading platforms, Bollinger Bands are truly valuable for traders who are seeking better insights into trading volume, price action, and overall market dynamics.
Stochastic Oscillator
The Stochastic Oscillator is a top tool among the leading technical indicators for stock trading. It’s all about checking out how fast and in what direction a stock’s price is moving.
It accomplishes this by comparing the most recent closing price to previous closing prices over a specified time period. Traders love it because it helps them spot when the market is too hot or too cold, hinting at when things might flip around.
- Overbought Condition: When you see the number going above 80, it usually means the stock’s being bought too much. This could be your signal to think about selling.
- Oversold Condition: On the other hand, if the price drops below 20, that signals not enough buying action, which might mean it’s a good time to buy.
How to Use:
- Crossovers: Keep an eye on when the %K line cuts over the %D line. This move can show you good times to either buy or sell, depending on which way it crossed.
- Divergence: Watch out when what the price is doing doesn’t match up with what the Stochastic Oscillator is showing. If prices hit new highs but the oscillator doesn’t, that could mean momentum is dropping and prices might start falling soon.
With its insight into where things are heading based on current trends in the market, adding a Stochastic Oscillator to your toolkit can significantly improve your trading skills on various platforms.
Volume Indicators
Volume indicators stand out among the leading technical indicators for stock trading. They play a key role in confirming if a trend is strong, based on trading volume. These tools help traders figure out if there’s more buying or selling happening and often hint at where prices might go next.
On-Balance Volume (OBV)
The On-Balance Volume (OBV) mixes volume with price changes. It adds up the volume when prices go up and subtracts it when they drop. The goal is to track both buying and selling pressure as one number, which can give clues about where a security’s overall volume is heading.
Volume Oscillator
The Volume Oscillator looks at the gap between two moving averages of volume: one quick and one slow. It’s great for spotting whether buyers or sellers are ramping up their game by comparing the increase in buying volume to selling volume.
Key Points on Usage:
- Spotting Trends: If the OBV is climbing, it usually means prices might too, confirming an uptrend. A dropping OBV suggests a possible downtrend.
- Predicting Breakouts: The Volume Oscillator is useful for calling breakouts. A high reading points to strong buyer momentum, possibly leading to an increase in prices. Conversely, a low reading shows seller dominance, which could mean prices are about to fall.
These indicators are extremely helpful for those looking to combine an understanding of market psychology with clear trading signals into their approach, especially since they’re widely available on many trading platforms.
Fibonacci Retracement
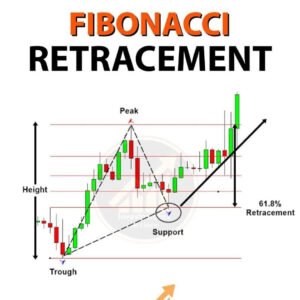
Fibonacci Retracement stands out as a top choice among the best technical indicators for stock trading. This tool excels at spotting likely support and resistance spots. It leans on the Fibonacci sequence, where each number is the sum of the two before it. Traders use Fibonacci Retracement to figure out when it is best to enter or exit the trades, or to set stop-loss orders.
How It Works:
- Identifying Reversal Levels: It’s awesome for catching moments when prices might swing back during a trend.
- Support and Resistance: The key Fibonacci Retracement levels — 23.6%, 38.2%, 50%, 61.8%, and 78.6% — often turn into places where prices have a hard time moving past.
- Entry and Exit Points: You may decide to enter a trade near one of these important Fibonacci levels and plan your exit near another one.
Traders love using Fibonacci Retracement because it plays well with other analysis tools, making it easier to figure out what’s happening in the market and adjust their strategies accordingly. Its flexibility across different assets and platforms also makes it a handy tool for navigating trading signals and market movements.
Ichimoku Cloud
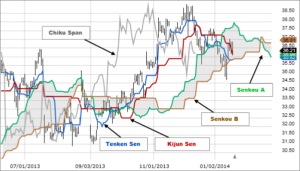
The Ichimoku Cloud stands out as a powerful tool for traders, sitting high on the list of top technical indicators for stock trading. It functions as a Swiss Army knife that shows both what’s happening now in the market and what might happen in the future. It does this magic with parts like Senkou Span A and B, Tenkan-sen, Kijun-sen, and the Chikou Span.
Breaking Down the Ichimoku Cloud:
- Senkou Span A and B: These bits make up the cloud itself, thrown ahead of today’s price. They help predict where support (where prices stop falling) and resistance (where prices stop rising) might pop up.
- Tenkan-sen (Conversion Line): Thinks about short-term price highs and lows to find a midpoint over about 9 periods.
- Kijun-sen (Base Line): Looks at a bit longer stretch – usually 26 periods – to find its midpoint between highs and lows.
- Chikou Span (Lagging Span): Takes today’s closing price but then steps back 26 periods to see how it fits into past trends.
How to Use It:
- Spotting Trends: If prices are hanging out above the cloud, things might be looking up (uptrend). Below it? Watch out for a possible downtrend.
- Finding Support and Resistance: The cloud changes shape and moves with prices, offering real-time areas where prices may rise or fall.
- Making Trade Decisions: When Tenkan-sen crosses over Kijun-sen, it could be your chance to make a move.
With its ‘one-glance’ approach, the Ichimoku Cloud shoots straight into invaluable territory for traders wanting a quick snapshot of market moods—a critical edge when navigating trading platforms or developing investment strategies that rely on understanding market psychology and identifying solid trading signals.
Conclusion
To wrap it up, we’ve walked through the top tech tips for trading stocks. These tools give us a peek into what’s happening with market trends, how prices move, and the buzz of trading activity.
Remember, though these indicators are slick, they shine brightest when you mix them with a solid grasp of how the market ticks and the nitty-gritty of financial tools. No magic bullet exists – no single tool will hand you success on a silver platter. But put these instruments together? That’s when your stock analysis on different trading platforms really levels up.