The stock market fear and greed index is a useful tool by CNN Business that helps figure out the state of investors and checks if stock prices seem right. They update this index every day, and by looking back at its past values, we can get an idea of how investors were feeling during big market moments. It’s really useful for making smarter investment choices, as long as it’s not the only thing you’re relying on.
Actually, the Fear and Greed Index is a way to see if investors are feeling more scared or greedy at any given time, which impacts stock prices. It has a scale from 0 (everyone is super scared) to 100 (everyone is overly greedy).
The idea here is simple: too much fear might mean stocks are cheaper than they should be because people are selling off like there’s no tomorrow. Too much greed? Prices might be higher than they ought to be since everyone’s buying like crazy.
Development of Fear and Greed Index
Back in 2012, the team at CNN Business launched the Fear and Greed Index. They use seven different ways to measure what’s driving the market—either fear is making prices drop or greed is raising them up.
The index points out when the market might be getting ready for a shift. It spots when emotions have pushed things to an extreme, which could mean it’s time to buy or sell.
How the Index Works Actually
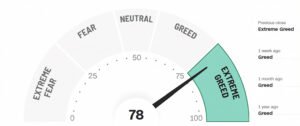
The index ranges from 0 (everyone’s scared) to 100 (everyone’s greedy). This range is key for understanding the stock market fear and greed index because it shows us where everyone’s heads are at, from total panic to over-the-top excitement.
Fear & Greed Index Scores and Sentiments
| Score | Sentiment |
| 0 to 24 | Extreme Fear |
| 25 to 44 | Fear |
| 45 to 55 | Neutral |
| 56 to 75 | Greed |
| 76 to 100 | Extreme Greed |
It uses seven big factors to get the emotional temperature of the market. Let’s unpack these:
- Market Momentum: looks at if the S&P 500 is doing better or worse than its usual performance, hinting at overall confidence.
- Stock Price Strength: checks how many stocks are hitting their peak compared to those hitting lows, with more peaks often meaning people are feeling bullish.
- Stock Price Breadth: measures if most stocks are getting more expensive or cheaper, showing where most of the money is moving.
- Put and Call Options: ratio shines a light on whether investors think we’re heading for good times or bad.
- Junk Bond Demand: watches how much more investors want risky bonds over safe ones, with less gap showing they’re feeling brave.
- Market Volatility: seen through the CBOE Volatility Index (VIX), tells us if things are getting too shaky for comfort.
- Safe Haven Demand: compares how much people want super-safe bonds versus stocks; more bond love suggests people are worried.
All these pieces together give us a snapshot of whether fear or greed is driving the market bus right now.
Fear and Greed Over Time
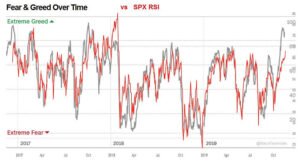
The stock market fear and greed index tells us about the fluctuation in sentiments of investors between fear and greed. These feelings change based on what’s happening in the market, affecting both stock prices and how investors act.
For example, when the market droops, a low index number shows that fear is in charge. This fear encourages many to sell their stocks, which can drop prices even more.
On the other hand, during good times in the market, a high index number means greed is taking over. This pushes stock prices up as people buy more aggressively. This back and forth is all about investor psychology influencing their choices and moving the market.
Why Does Index Matter?
Fear in the Market
The stock market fear and greed index shows us that when investors get scared, they might sell too quickly. This can make stock prices fall because:
- Market Downturn: Fear leads to more selling, which lowers stock prices.
- Investor Reactions: Scared investors might ditch their long-term plans just to get out fast, making things worse.
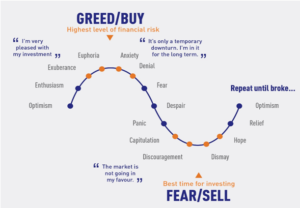
Greed in the Market
But it’s not all about fear. The index also looks at how too much excitement can lead to overbuying. When greed takes hold:
- Market Bubbles: Too much buying pumps up prices beyond what’s reasonable.
- Investors Behavior: Greed pushes people to risk too much for quick gains, often ignoring solid investment principles.
Using the Fear and Greed Index
For Individual Investors
The stock market fear and greed index comes in handy for those investing on their own. It acts like a mood ring for the market, showing if investors are feeling scared or greedy. This information can help you decide when to buy or sell by looking at the general sentiment.
But, it’s smart to not rely on this alone. Mixing what you learn from the index with other research and a solid look at the basics makes your strategy stronger. This way, you’re better protected against market volatility and making decisions just based on feelings.
For Market Analysts
For those analyzing markets, the stock market fear and greed index is one tool among many for guessing where things might head next, especially regarding how people are feeling about investing (investor sentiment).
The index isn’t everything. An analyst knows how to balance it with a thorough examination of data, industry trends, and major global events. Putting all these pieces together gives analysts a fuller picture so they can offer sharper advice and insights, helping everyone deal with stock market twists and turns.
- Predictive value: While the index may indicate where the market’s heading, it’s not foolproof.
- Comprehensive analysis: To really understand what’s going on, analysts combine this index with wider investigations.
- Limitations: Remember, this gauge shows current moods that can change fast because of stuff happening outside of stocks themselves.
Conclusion
We’ve explored the stock market fear and greed index by CNN Business, a key measure of what’s driving investors’ emotions in the stock market. This guide has covered where it comes from, what it aims to do, and the emotions it tracks.
Here are the main takeaways:
- The scale of the index goes from 0 (showing Extreme Fear) to 100 (indicating Extreme Greed).
- It checks on seven different things: stock price momentum, stock price strength, stock price breadth, put and call options, junk bond demand, market volatility, and safe haven demand.
- Looking back at past trends gives us information about how fear and greed affect both stock prices and how investors act.
- While individual investors might use this index to try timing their moves in the market, it’s best to combine it with other ways of analysis.
- Analysts also look at this index for predicting where things might head but have to keep wider economic and world events in mind for a full picture.
In wrapping up, though the stock market fear and greed index offers insight into investor sentiment and market volatility, relying solely on it for making investment choices isn’t recommended. A well-rounded strategy that includes both this index and other analytical tools is crucial for tackling financial market challenges effectively.