If you’re new to the Stock Market, understanding how to read stock market charts is key. These price charts give you a visual insight into the price movements of stocks over time. They are essential for visual market analysis, or Technical Analysis.
Importance of Stock Charts
Using Stock Charts is important because they help track a stock’s historical price and its present value. As a newbie, learning these charts is handy in guiding your buy or sell decisions. By knowing how to read them, you’ll get the hang of market trends and make better investment choices.
Types of Stock Charts: line, bar, and candlestick
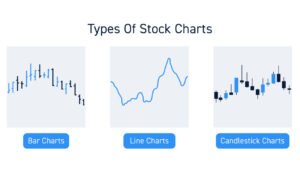
Now let’s discuss three main types of stock charts in the investing world: line, bar, and candlestick.
- The simplest are Line Charts, showing the closing price of a stock for each day.
- If you want details such as opening prices and daily highs and lows, go through Bar Charts.
- To get an in-depth view that includes which way prices trended along with range during trading periods, turn to detailed Japanese-developed Candlestick Charts.
Understanding the basic price terms
Whenever you look at any kind of Stock Chart, four important terms will always pop up: high, low, open, and close.
- ‘High’ and ‘low’ indicate the maximum and minimum prices that a stock hit within certain timeframes.
- ‘Open’ tells us about the starting price at the beginning; ‘close’ signals where it ended up at the end.
Getting familiar with these core ideas is your entry point into investing’s intricate realm. Understanding these terms empowers you to identify patterns and tends in your financial journey. Armed with this beginner knowledge, you’re laying down solid groundwork to tackle more complex chart readings as you progress.
Components of a Stock Chart
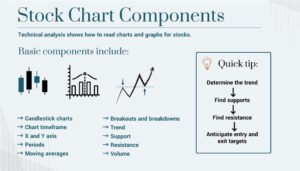
To get the hang of how to read stock market charts for beginners, you need to know what each part of a stock chart tells you. Each component shows you how well a stock has done over time, guiding your trading choices.
Axes
All stock charts have two axes – horizontal and vertical. The horizontal or x-axis shows time, while the vertical or y-axis covers the price.
- On the x-axis, time can be set to different scales, whether it’s minutes or years, it all depends on what information you’re looking for.
- The y-axis lets us track how the price shifts over time.
Price and Volume
The most essential bit charted is the price. It reveals where a stock’s value is at and compares that against its past performance.
Then there’s volume – showing how many shares exchange hands in a given period. To make sense of volume changes, investors often use a Volume Moving Average (VMA), which helps see the bigger picture more clearly by smoothing out sporadic jumps.
Range and Period
A chart’s range tells you how much the price differed from low to high during certain periods. Meanwhile, the period gives us an idea about what duration each data point represents on our chart. By tweaking these —the range and period— you can gain different viewpoints regarding historical pricing activity for any given stock.
Indicators
For those who dive deeper into their analysis, Stock Charts include indicators related to technical strategies. One popular measure is the Moving Average, which clears out noise in pricing to highlight ongoing trends. There are also markers like Support and Resistance Levels; they hint at where prices may pause or even switch direction. Beyond those basics, some charts might layer in things like trade volumes or key business metrics for additional depth in analysis.
Analyzing Stock Charts
Now that you know the building blocks of a stock chart, let’s learn how to analyze them. Analysis is about spotting trends, figuring out where Support and Resistance Levels stand, recognizing trading shapes, and looking into trade volumes. This kind of insight could give you an edge in forecasting what the prices might do next, guiding your investment choices.
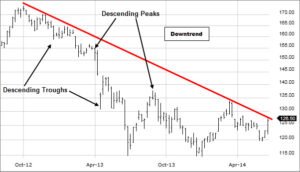
Identifying trends
Spotting the overall direction where a stock price is headed—upwards (bullish), downwards (bearish), or just moving sideways—is called identifying a trend. Knowing which way a trend is going can help you decide whether it’s time to buy or sell. If prices are generally going up, it might be your cue to purchase stocks; if they’re dropping, it could be time to sell. To see these trends more clearly on your chart, you can draw simple lines that trace the stock price over time.
Recognizing Support and Resistance Levels
In Technical Analysis, some of the most crucial concepts are Support and Resistance Levels. ‘Support’ is where the price stops falling and starts picking up again—this suggests people really want to buy at this price point. On the flip side, ‘Resistance’ is where rising prices tend to pause or fall because lots of folks are ready to sell. Spotting these points can clue you in on smart times to buy or sell.
For newcomers learning how to read stock market charts for beginners, grasping these levels can make a big difference in developing savvy investing tactics. And don’t worry—there’s plenty of help like beginner investing guides and sophisticated chart tools to take you through this process step by step.
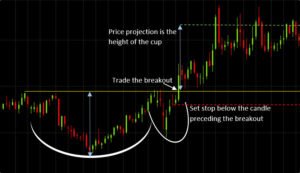
Understanding trading patterns
Grasping common patterns that show up on stock charts is another huge part of reading charts as a newbie investor. These shapes come from how stock prices flutter up and down over time.
For example:
- A “head and shoulders” pattern can signal that an upward trend might change course.
- “Double bottoms”, however, suggest a downward trend could be turning around.
Spotting these patterns gives investors hints about what might happen next with stock prices, allowing for smarter bets in the market.
Reading the volume
Trading Volume is a key part of analyzing stock charts. It tells you how many shares change hands in a given time. Lots of movement means people are really interested, and big price changes might be happening. On the other hand, not much volume could mean people don’t care as much. If Trading Volume goes up when prices are also going up, it can mean the trend will keep going. But if volume drops while prices rise, that could mean a turnaround is coming.
Looking at patterns and how much trading is happening helps beginners understand how to read stock market charts. When you put it together with spotting trends and figuring out where the Support and Resistance Levels are, you get a clear picture of where a stock has been and where it might go.
Using Stock Charts for Investment Decisions
If you want to make smart choices with your investments, you’ve got to know how to read stock market charts. These charts show the history of a stock’s price and its Trading Volume, giving you facts without all the noise from rumors or scary headlines.
How Stock Charts Can Inform Investment Strategies
With Stock Charts, investors have an easier time making strategy decisions. They help spot both short-term swings and long-term tendencies based on trends, knowing where support masks trouble spots, understanding movements in trading patterns—all of this can guide buyers considering when’s the right moment to jump into stocks or when they should back off.
The Importance of Looking at a Stock’s Chart on Multiple Time Frames
Checking out different timelines on a stock’s chart gives investors more info. Quick look timelines can catch fast trends while wide window ones offer insights over longer hauls; this helps investors feel out real stability or pick up on crucial slow-moving trends.
The Role of Stock Charts in the Broader Context of Investment Decision-Making
But remember, don’t just look at one thing! Use those neat chart insights along with solid data like company earnings and financial status—that’s what savvy investors do. Mix technical stuff like reading those chart lines with nuts-and-bolts company info for top-notch decision-making about stocks.
Additional Resources for Learning
If you’re starting to learn how to read stock market charts for beginners, remember, it’s an ongoing process. Lots of helpful resources are out there.
Check out online spots like Google Finance, Online Stock Brokers, and other Financial Websites. They’ve got tons of details plus tools you need to get your head around Stock Charts. The real-time price data they offer is key. It shows you what’s up in the market, so you make savvy trades.
For more advanced tools, dive into Advanced Charting Platforms. They’ve got a bunch of different ways to show you Stock Charts and kits for doing Technical Analysis. With these, figuring out those tricky things like Stock Chart Patterns, getting the hang of Trading Volume, or spotting where the markets’ got its floor or ceiling (that’s your Support and Resistance Levels) becomes easier.
Wrapping it up, picking up the art of reading those confusing financial graphs – is all about keeping at it. Plug into all these resources and practice a ton. You’ll get sharper at making sense of those wiggly lines on the Stock Charts and that means making smarter money moves in no time.