Financial statements are important for managers, investors and entrepreneurs to know about a company’s financial health and performance. This skill helps stakeholders to make right investment decisions, determine business efficiency and assess investment opportunities.
The main financial statements involve balance sheets, income statements and cash flow statements. These statements give an overview of a company’s financial position, cash management and profitability. Analyzing financial statements help individuals to get valuable insights and make right business decisions.
Types of Financial Statement

It’s important to know the different financial reports and purposes to effectively analyze financial statements. Each statement gives various insights into a company’s finances, allowing investors to make right decisions.
Major types of financial statements are given below:
Balance Sheet

The balance sheet is a basic financial statement that shows a company’s financial position at a specific point in time. It follows the accounting equation that is:
Assets = Liabilities + Shareholder’s Equity.
This statement is very important for a comprehensive analysis of financial statements.
Key components of a balance sheet are given below:
- Assets: Resources owned by the company with economic value. These are current assets (easily converted to cash in a year) and non-current assets (long-term and fixed assets).
- Liabilities: Financial obligations owed the company to external parties. These are current liabilities (due in a year) and non-current liabilities (long-term debts).
- Shareholders Equity: shows residual interest in assets after liabilities. Includes contributed capital and retained earnings.
The balance sheet provides important data to assess a company’s stability, solvency and liquidity. By examining assets along with liabilities, analysts evaluate the ability to meet short and long-term obligations.
Income Statement

The income statement, also called the profit and loss (P&L) statement shows financial results of a company over a period of time. It’s an important tool for analyzing financial statements professionally.
Components involved in income statement are:
- Revenue: Total money earned from selling goods and services. Often called the “top line”
- Expenses: All costs linked to generating revenue, including the cost of goods sold (COGS), operating costs and non operating expenses.
- Net Income: The “bottom line,” representing profit or loss after subtracting all expenses from revenue.
The equation in the income statement is:
Revenue minus Expenses = Net Income.
The report helps assess profitability, identify revenue and expense trends and compare its performance to previous periods or industry peers.
When reviewing the income statement, consider the gross profit margin (revenue minus COGS) and operating profit margin (operating income divided by revenue). These show efficiency in generating core operating profit.
Cash Flow Statement

The cash flow statement is important to analyze financial statements. It shows a company’s cash position and liquidity by listing cash inflows and outflows over a specific period.
Three main parts of cash flow statement are given as:
- Operating Activities: Reflect cash from core business operations, such as money from clients and payments to employees and suppliers.
- Investing Activities: Captures cash flows from investments, including buying or selling long-term assets like investment in securities, plant, equipment and property.
- Financing Activities: Covers cash flow from financing activities such as dividend payments, loan proceeds or repayments and issuing or repurchasing of stocks and bonds.
By examining a cash flow statement, analysts can evaluate a company’s ability to generate operational cash, see how it allocates cash and assess its reliance on external financing.
Financial Statements Analysis Techniques
Analyzing financial statements is a critical skill for stakeholders,investors and managers who want to evaluate a company’s financial health and performance. Various techniques can be used to analyze financial statements and gain valuable insights.
Some of main techniques used in financial statement analysis are given below:
Horizontal Analysis
Trend analysis, also called horizontal analysis, is used to compare financial data over a particular time period, typically years or quarters. It helps identify trends and growth patterns in the financial performance of the company, assisting in evaluating progress and making projections.
To conduct horizontal analysis following steps are involved:
- Contrast financial data from the current numbers with data from previous periods
- Calculate absolute dollar change for each line item
- Find percentage change relative to base period
Seeing how specific items change over time shows where a company is strong or weak. For example, rising revenue or lower costs represent positives, but decreasing profits or increasing debt levels may raise concerns.
Vertical Analysis
Vertical analysis is a powerful tool used to evaluate financial statements by showing each line item as a percentage of a base figure in the statement. This method lets you clearly understand the composition and relative value of different elements in the financials.
While performing vertical analysis of statements follow these steps:
- Choose a base figure for each statement:
- For a balance sheet, use total assets or total liabilities and equity.
- For income statements, use total revenue or net sales.
- Calculate the percentage of each line by dividing it by the base and multiplying by 100.
- Interpret the results to evaluate financial health, spot trends and benchmark against industry.
Vertical analysis has several benefits:
- Allows comparison of statements across different companies or periods, regardless of size differences.
- Shows the relative importance of each component.
- It helps to find out potential red flags such as excessive costs or low liquidity.
Ratios Analysis

Ratio analysis involves calculating and decoding financial ratios to find a company’s ability to pay debts, liquidity, profitability and efficiency.
Key Types of Ratios are:
- Profitability ratios – Measure a company’s ability to generate profits compared to equity, assets or revenue. Examples are return on equity (ROE), net margin, gross margin and return on assets (ROA).
- Liquidity ratios – Assess if a company can meet short-term obligations with current assets. Main Ratios are the cash ratio, quick ratio and current ratio.
- Solvency ratios – Evaluate the long-term financial health and capacity to repay long-term debts. Examples are the debt-to-equity ratio and the interest coverage ratio.
- Efficiency ratios – Measure how well assets are utilized and liabilities are managed. Important ratios include asset turnover, inventory turnover and receivables turnover.
When analyzing ratios, consider the following steps:
- Compare ratios over time to identify trends and changes in company performance.
- Benchmark ratios against industry averages and competitors to evaluate company’s performance
- Use different ratios to fully understand financial health, as depending on one can be misleading.
Advanced Analysis Techniques
DuPont Analysis
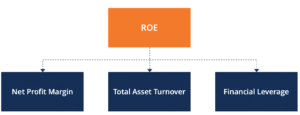
DuPont breaks down return on equity (ROE) into its component parts, allowing it to identify variables that determine a company’s ROE.
By splitting ROE into net profit margin, asset turnover and financial leverage (equity multiplier). The Dupont enables a deeper understanding of operational efficiency, leverage and asset use. This analysis helps pinpoint strengths and weaknesses to address.
DuPont Corporation popularized the DuPont analysis in the 1920s. It shows if ROE of a company comes from profitability, asset efficiency or leverage, which allows for more accurate financial health and performance evaluation.
Discounted Cash Flow (DCF) Analysis
Discounted cash flow (DCF) analysis predicts investment value on the basis of expected cash flows in future. By discounting the flows to their present value using a target rate of return, investors can determine if the investment is worthwhile.
Steps involved in DCF analysis are:
- Estimating future cash flows over a period
- Choosing an appropriate discount rate, often weighted average cost of capital (WACC)
- Calculating present value of each cash flow using the rate
- Summing the present values for investment total value
- Comparing the calculated value to cost to assess profitability
DCF analysis is powerful for evaluating investments, but relies heavily on cash flow projections and the chosen discount rate. Despite limitations, DCF remains widely used in financial decisions.
Steps to Analyze Financial Statements

Some important steps to follow while analyzing financial statements are given below:
- Gather and check financial statements: Get the company’s cash flow, balance sheet and income statement for the time period you want to review.
- Identify industry economics: Understand the value chain and economic features of the industry the company works in.
- Check financial statement quality: Evaluate the statements based on relevant accounting standards to ensure accurate economic position and performance.
- Analyze current profit and risk: Use key ratios for debt, profit, liquidity, assets and risk to review current financial health.
- Forecast financial statements: Make reasonable assumptions about future performance and create projected statements using percent of sales method.
- Evaluate overall financial health: combine insights to comprehensively assess the financial position, performance and prospects.
Interpreting Financial Statements
Interpreting financial statements is important to analyze a financial situation of a company. It means looking above the numbers to understand the story they tell about financial health and future predictions.
Consider following steps while interpreting financial statements:
- Spot trends and patterns in the data over time
- Compare company’s performance against industry averages and competitors
- Judge liquidity, profitability and ability to pay obligations of a company
- Assess the quality and sustainability of profits
- Consider the effect of one-time events or accounting method changes
Practical Tips for Effective Analysis

When analyzing financial data, follow these practical steps to improve your analysis:
- Compare similar companies in the same sector to make sure a fair and relevant assessment of financial performance.
- Study different periods to find trends and patterns. This gives a wider view than a single timeframe.
- Join financial analysis with qualitative research such as strategy, management and competition to get the full overview.
- Stay current on accounting rules and regulations that can affect interpreting statements.
Conclusion:
Mastering the art of analyzing financial statements is a continuous learning process that requires regular practice and learning. You can create an overall technique to evaluate companies by incorporating financial analysis to your investment decisions,
Take into consideration that success results by utilizing both quantitative and qualitative research to properly understand future predictions and financial health.